1 / 0

Dimensions Of Product Quality (Garvin)

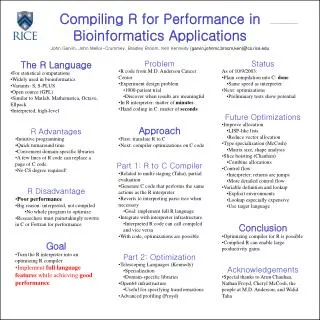
Dimensions Of Product Quality (Garvin). 1. Performance basic operating characteristics 2. Features “extra” items added to basic features 3. Reliability probability product will operate over time 4. Conformance meeting pre-established standards. 5 . Durability

feleti
Download Presentation

Dimensions Of Product Quality (Garvin)

An Image/Link below is provided (as is) to download presentation Download Policy: Content on the Website is provided to you AS IS for your information and personal use and may not be sold / licensed / shared on other websites without getting consent from its author. Content is provided to you AS IS for your information and personal use only. Download presentation by click this link. While downloading, if for some reason you are not able to download a presentation, the publisher may have deleted the file from their server. During download, if you can't get a presentation, the file might be deleted by the publisher.

E N D

Presentation Transcript


  1. Dimensions Of Product Quality (Garvin) 1. Performance basic operating characteristics 2. Features “extra” items added to basic features 3. Reliability probability product will operate over time 4. Conformance meeting pre-established standards
  2. 5. Durability life span before replacement 6. Serviceability ease of getting repairs, speed & competence of repairs 7. Aesthetics look, feel, sound, smell or taste 8. Safety freedom from injury or harm 9. Other perceptions subjective perceptions based on brand name, advertising, etc
  3. Service Quality 1. Time & Timeliness customer waiting time, completed on time 2. Completeness customer gets all they asked for 3. Courtesy treatment by employees e
  4. 4. Consistency same level of service for all customers 5. Accessibility & Convenience ease of obtaining service 6. Accuracy performed right every time 7. Responsiveness reactions to unusual situations
  5. The Meaning of Quality Producer’s Perspective Consumer’s Perspective Quality of Conformance Quality of Design Production Marketing Quality characteristics Price Conformance to specifications Cost Fitness for Consumer Use
  6. Quality Of Conformance Ensuring product or service produced according to design Depends on design of production process performance of machinery materials training
  7. Sales Gains via Improved response Flexible pricing Improved reputation Improved Quality Increased Profits Reduced Costs via Lower rework and scrap costs Lower warranty & product liability costs Two Ways Quality Improves Profitability
  8. Cost Of Quality Cost of achieving good quality Prevention Appraisal Cost of poor quality Internal failure costs External failure costs
  9. Quality And Productivity Productivity = output / input Fewer defects increase output Quality improvement reduces inputs
  10. Measuring Yield & Productivity where Y = yield I = number units started in production % G = percentage good units % R = percentage of defective units reworked Y = (I)(%G) + (I)(1-%G)(%R)
  11. Product Yield Example Start 100 motors per day 80% are good 50% of poor quality units can be reworked Y = (I)(%G) + (I)(1-%G)(%R) Y = 100 (0.80) + 100 (1- 0.80) (0.50) = 90 motors
  12. Product Cost
  13. Product Cost Example Direct mfg cost = $30, Rework cost = $12 100 motors started, 20% defective 50% of defective motors can be reworked
  14. Total Quality Management 1. Customer defined quality and satisfaction 2. Top management leadership 3. Quality as a strategic issue 4. All employees responsible for quality 5. Continuous improvement 6. Shared problem solving/ Cross-discipline system approach 7. Statistical quality control: measurement of results 8. Mutually beneficial supplier relations
  15. Options to Improve Quality of Conformance Consumer Education: product labeling, instructions, online resources Follow-up Service: Recalls, extended warranties, replacements Inspection of Work and Product Preventative Procedures
  16. Inspection Involves examining items to see if an item is good or defective Detect a defective product Does not correct deficiencies in process or product It is expensive Issues When to inspect Where in process to inspect
  17. Inspection Tools System or process problems: Statistical process control techniques Material or lot problems: Acceptance sampling techniques
  18. 10 UCL = 9.85 9 c = 6.17 8 7 Mg of salt 6 5 4 LCL = 2.99 3 2 4 6 8 10 12 14 16 Sample number Control Chart
  19. Preventative Procedures Improve Quality of Design: Design product/process for robustness, poka-yoke, Taguchi Statistics Implement Six Sigma Involve Employees: Training, empowering, soliciting input Form strategic supplier partnerships Remove safety nets: carrying JIT inventory and requiring minimal lead times
  20. Six Sigma Two meanings Statistical definition of a process that is 99.9997% capable, 3.4 defects per million opportunities (DPMO) A program designed to reduce defects, lower costs, and improve customer satisfaction
  21. Six Sigma Define critical outputs and identify gaps for improvement Measure the work and collect process data Analyze the data Improve the process Control the new process to make sure new performance is maintained DMAIC Approach
More Related