Download
1 / 19
440 likes | 1.3k Views
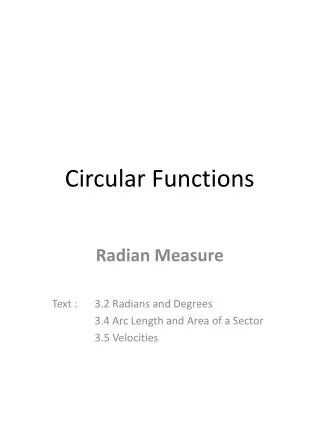
Chapter 4 Graphs of the Circular Functions. Section 4.1 Graphs of the Sine and Cosine Functions. Periodic Functions Many things in daily life repeat with a predictable pattern, such has weather, tides, and hours of daylight.

E N D
Section 4.1 Graphs of the Sine and Cosine Functions Periodic Functions Many things in daily life repeat with a predictable pattern, such has weather, tides, and hours of daylight. If a function repeats its values in a regular pattern, it is called a periodic function. The following is a periodic graph that represents a normal heartbeat.
Definition A function f is called a periodic function if there is a positive real number p such that f (x) = f (x + np) for every real number x in the domain of f and every integer n. The least possible value of p is called the period of the function.
Graph of the Cosine function Compare this with the graph of the Sine function.
Amplitude = (vertical distance between peak and trough)/2 = 2×amplitude
The length of a Period (or simply Period) = (horizontal distance between adjacent peaks) = (horizontal distance between adjacent troughs) one period
Section 4.2 Translations of the Graphs of the Sine and Cosine Functions
Vertical shift is the amount that the magenta curve is moved up (or down) compared to the reference (grey) curve. A positive shift means an upward displacement while a negative shift means a downward displacement. vertical shift This grey curve is for reference.
Phase Shift (horizontal shift) is the amount of horizontal shift compare to a curve with the same period and passing through the origin (if it has no vertical shift). This value can be positive or negative. A positive phase shift means the curve is shift to the right compared to the black curve. A negative phase shift means the curve is shifted to the left compared to the black curve. Amount of positive shift Amount of negative shift This grey curve is for reference.
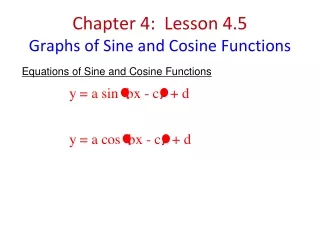
In the next slide, we will explore how the coefficients in the equation y = a sin(bx – c) + d affect the amplitude, period, phase shift, and vertical shift of the corresponding curve.
Conclusions • Let y = a sin(bx – c) + d be the equation of the curve. • Then • |a| is the amplitude • b is inversely proportional to the period but directly proportional to frequency. In fact period = 2π / |b| • c is proportional to phase shift, more precisely phase shift = c / |b| • dis the vertical shift.
The next slide show how two Sine waves of almost equal frequencies can create a “beat” effect on the amplitude.
Section 4.3 Graphs of the Tangent and Cotangent Functions Graph of the Tangent function
Graph of the Cotangent function For comparison