Download
1 / 11
110 likes | 255 Views
Modified expression of an auxin-responsive rice CC-type glutaredoxin gene affects multiple abiotic stress responses Raghvendra Sharma, Pushp Priya and Mukesh Jain.

E N D
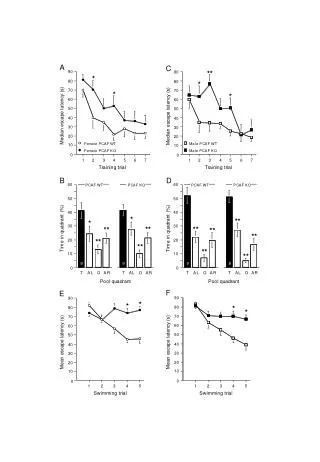
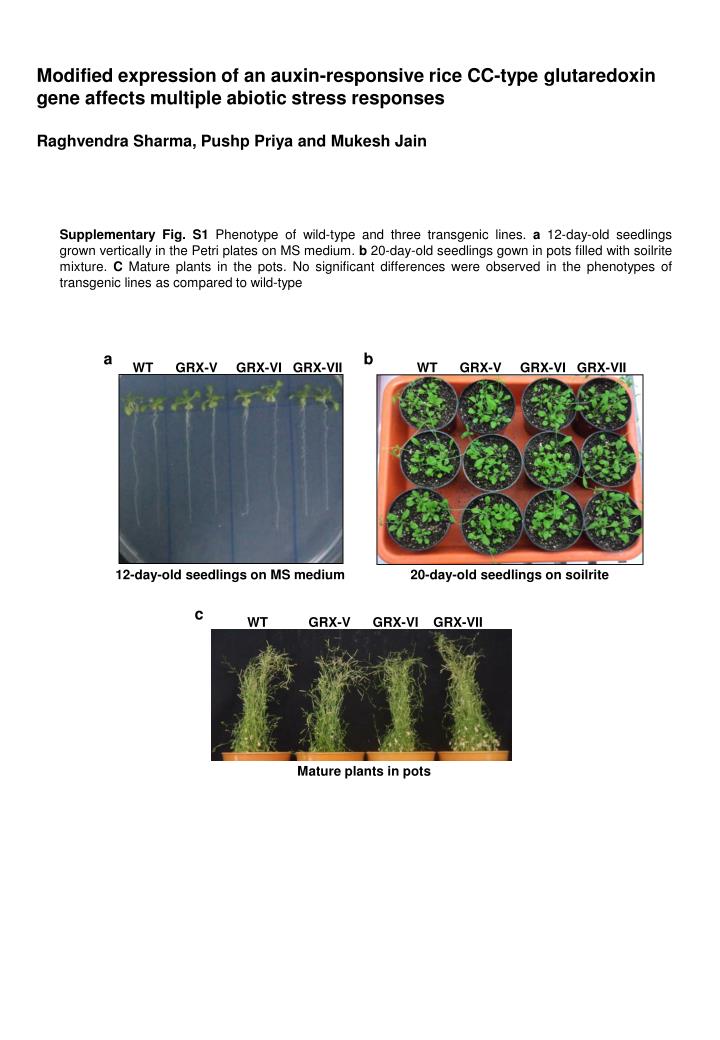
Modified expression of an auxin-responsive rice CC-type glutaredoxin gene affects multiple abiotic stress responses Raghvendra Sharma, Pushp Priya and Mukesh Jain Supplementary Fig. S1 Phenotype of wild-type and three transgenic lines. a 12-day-old seedlings grown vertically in the Petri plates on MS medium. b 20-day-old seedlings gown in pots filled with soilrite mixture. C Mature plants in the pots. No significant differences were observed in the phenotypes of transgenic lines as compared to wild-type a b WT GRX-V GRX-VI GRX-VII WT GRX-V GRX-VI GRX-VII 12-day-old seedlings on MS medium 20-day-old seedlings on soilrite c WT GRX-V GRX-VI GRX-VII Mature plants in pots
120 WT GRX - V 100 GRX - VI GRX - VII 80 Relative root growth (%) 60 40 20 0 0 100 200 300 120 Mannitol (mM) WT GRX - V 100 GRX - VI 80 Relative root growth (%) 60 40 20 0 0 100 150 200 250 Supplementary Fig. S2 Effect of salt and osmotic stress on wild-type and transgenic Arabidopsis plants. Inhibition of root growth in the presence of NaCl (a) and mannitol (b). The root length of NaCl- and mannitol-treated seedlings was expressed as a percentage of control incubated on NaCl- and mannitol-free medium. Data from three transgenic lines along with WT are presented. The experiments were repeated at least three times and data of only representative experiment is shown. Values are mean ± SE for 12-15 seedlings each. Data points marked with asterisk (*P ≤ 0.05 and **P ≤ 0.01) indicate statistically significant difference between WT and transgenic lines a * * ** * NaCl (mM) b * **
Supplementary Fig. S3Effect of mannitol on wild-type and transgenic Arabidopsis plants. Inhibition of seed germination in the presence of mannitol. Data from three transgenic lines (GRX-V, GRX-VI and GRX-VII) along with wild-type (WT) are presented. The number of germinated seeds was expressed as the percentage of total number (40-60) of seeds plated. Values are mean ± SE from three independent experiments. The differences in WT and transgenic lines were not found to be significant by Student’s t-test WT 120 GRX - V GRX - VI 100 GRX - VII 80 Germination (%) 60 40 20 0 0 100 200 300 400 Mannitol (mM)
120 WT GRX - V 100 GRX - VI GRX - VII 80 Germination (%) 60 40 20 0 0 5.0 10.0 15.0 20.0 H2O2 (mM) Supplementary Fig. S4 Effect of oxidative stress on wild-type and transgenic Arabidopsis plants. Inhibition of seed germination in the presence of hydrogen peroxide. The number of germinated seeds was expressed as the percentage of total number (40-60) of seeds plated. Values are mean ± SE from three independent experiments. Data points marked with asterisk (*P ≤ 0.05) indicate statistically significant difference between WT and transgenic lines * * *
WT GRX-V GRX-VI WT GRX-V GRX-VI Control Control 5 mM 100 mM 10 mM 200 mM 300 mM Supplementary Fig. S5 Leaf disc assays showing salt and oxidative stress tolerance of wild-type and transgenic Arabidopsis plants. The leaves from mature wild-type and transgenic plants were floated on different concentrations of NaCl (a) and hydrogen peroxide (b) and photographed after three days of incubation a b
Supplementary Fig. S6 Multiple abiotic stress tolerance of wild-type and transgenic Arabidopsis plants. The 30-day-old plants were treated with different stresses, including salt (200 mM NaCl), drought (by withholding water for 20 days), hydrogen peroxide (20 mM), methyl viologen (25 µM) for 7 days and photographed Control Salt Drought WT GRX-V GRX-VI WT GRX-V GRX-VI H2O2 Methyl viologen
Supplementary Fig. S7 Specificity of OsGRX8 knockdown in RNAi lines. Real-time PCR analysis showing expression of OsGRX13 (closest homolog of OsGRX8) in wild-type and transgenic plants. No significant change in expression was observed.Data are mean ± SE from three biological replicates Relative mRNA levels
WT G1 G35 Control WT G1 G35 150 mM Mannitol Supplementary Fig. S8 Hormone and stress response of wild-type and RNAi transgenic rice plants. (a,b) Root growth of wild-type and transgenic rice seedlings grown on MS medium supplemented with 1 µM IAA (a) and 4 µM ABA (b). (c) Seed germination of wild-type and RNAi lines on MS medium supplemented with 150 mM mannitol WT G1 G35 Control Control c a b WT G1 G35 4 µM ABA 1 µM IAA
WT G35 WT G35 0 mM 0 mM 100 mM 5 mM 200 mM 10 mM 300 mM 15 mM 400 mM 20 mM Supplementary Fig. S9 Stress response of wild-type and RNAi transgenic rice plants. Leaf disc assays showing salt and oxidative stress tolerance of wild-type and transgenic RNAi rice plants. The leaves from mature wild-type and transgenic plants were floated on different concentrations of NaCl (a) and hydrogen peroxide (b) and photographed after three days of incubation a b
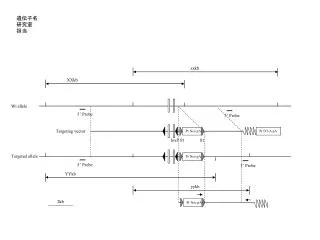
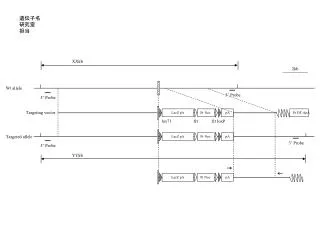
IAA (126) MV (470) 2 5* GRX (126) WT (193) 41 (12) 210 (45) 1 (2) 7* 35 (10) 10* 101 (32) 63* 46 (63) 25 (19) 70 (11) 934 (881) IAA GRX (2077) WT (1926) NaCl (2077) 207 (243) 199 (100) 882 (744) IAA (193) MV (818) 5 (6) 7* NaCl 292 (153) 56 (34) GRX (470) WT (818) 5 (5) 9* 30 (14) 19* 151 (61) 116* 196 (208) 33 (29) 338 (68) 839 (676) NaCl (1926) MV Supplementary Fig. S10 Venn diagrams showing number of differentially expressed genes in wild-type and over-expression transgenic lines in microarray analysis. (a, b) Venn diagrams showing number of differentially expressed genes in transgenic Arabidopsis line (a) and wild-type (b) in the presence of IAA, MV and NaCl. (c) Number of genes differentially expressed commonly or specifically regulated under different conditions. The numbers outside the Venn diagrams represent total number of genes differentially expressed and the numbers within Venn diagrams represent the number of genes up-regulated, down-regulated (in parentheses) and up-regulated under one and down-regulated under other condition (marked with asterisk) a c b
Supplementary Fig. S11 Real-time PCR validation of expression profile of representative genes selected from microarray results. The transcript levels of selected genes in wild-type (a) and GRX over-expression transgenic Arabidopsis line (b) under different conditions are shown. The transcript levels for each gene under different conditions/treatments were calculated relative to the expression in control condition.Data are mean ± SE from three biological replicates a 6 IAA NaCl 4 MV 2 0 Relative transcript levels - 2 - 4 - 6 - 8 - 10 b 35 IAA 30 NaCl 25 MV 20 15 Relative transcript levels 10 5 0 - 5 - 10 - 15