Download
1 / 31
360 likes | 786 Views
A 256kb Sub-threshold SRAM in 65nm CMOS. Benton H. Calhoun, Anantha Chandrakasan Massachusetts Institute of Technology, Cambridge, MA ISSCC 2006 / SESSION 34 / SRAM / 34.4. Advanced VLSI class presentation. Presented by: Pouya Kamalinejad. 2006/12/28. Outline .

E N D
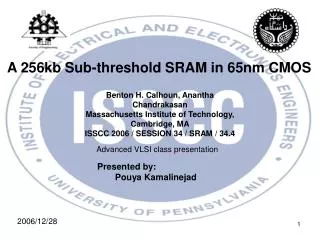
A 256kb Sub-threshold SRAM in 65nm CMOS Benton H. Calhoun, Anantha Chandrakasan Massachusetts Institute of Technology, Cambridge, MA ISSCC 2006 / SESSION 34 / SRAM / 34.4 Advanced VLSI class presentation Presented by: Pouya Kamalinejad 2006/12/28
Outline • Introduction and preliminaries. • SNM introduction. • Proposed 10T SRAM • Simulation and results • Read SNM free SRAM • Conclusion
The minimum supply voltage of LSIs is limited by their SRAMs for the following two reasons[2]: 1) with decreasing supply voltage (Vdd), SRAM delay increases at a higher rate than does CMOS logic circuit delay. 2) Read operations at low-Vdd levels result in storage data destruction in SRAM cells. Why Low Voltage SRAMs?
Preliminaries Traditional 6-T SRAM column[3] Bitline discharging for the reaoperation[3]
BLB BL WL VN M3 M6 M2 M5 M1 M4 Q QB VN Static Noise Margin • The large fraction of chip area often devoted to SRAM makes low power SRAM design very important. • SNM quantifies the amount of voltage noise required at the internal nodes of a bitcell to flip the cell’s contents. • degraded SNM can limit voltage scaling for SRAM designs. SNM is length of side of the largest embedded square on the butterfly curve Inverter 1 Inverter 2 [1]
Cont’d The minimum supply voltage of SRAMs is determined by both Read SNM and Write SNM levels; reducing Vth in the NMOS transistor improves Write SNM but worsens Read SNM. Moves to the left Moves upward SNM Butterfly Curve SNM is lower during read access because the VTC is degraded by the voltage divider across the access transistor (M2,M5) and drive transistor (M1,M4)[2]
BLB prech 1 BL prech 1 WL=1 M3 M6 M2 M5 M1 M4 1 0 BLB BL WL=0 M3 M6 M2 M5 M1 M4 1 0 SNM during HOLD and READ [1] Read SNM is worst-case
Sub-VT SNM Dependencies • SNM is mainly a function of: • Vdd (limited to Vdd/2) • Temperature (higher temp results in Lower SNM due to lower gain) • Sizing (Cellratio affects SNM less in sub-threshold due to logarithmic relation unless it affects Vt) • Bit-line voltage • Vt mismatch Model* gives good estimate for the distribution of SNM at the worst-case tail Normal distribution Vt mismatch is the worst [1]
How to reduce Vdd? Impact of local mismatch on 6T SNM in 65nm. Read SNM has larger standard deviation. Hold SNM at 0.3V has roughly the same mean as Read SNM at 0.5V and same 6σ SNM as Read SNM at 0.6V.[2] Thus, by eliminating the degraded Read SNM, a bitcell can be operated at 0.3V with the same 6σ stability as a 6T bitcell at 0.6V. A
BLB RWL RBL BL WL VVDD Q QB Cont’d • The idea is to add a 4T buffer at one side: M7 to M10 to remove the problem of Read SNM by buffering thestored data during a read access. M9 M8 M10 Thus, the worst-case SNM for this bitcell is the Hold SNM related to M1 to M6, which is the same as the 6T Hold SNM for same sized M1 to M6 M7 6T bitcell 4T buffer Proposed 10-T bitcell for Sub-VT[1]
RBL=1 QBB held near 1 so the leakage current through M8 is reduced 0 0 RBL=1 QBB =1 QB=1 QB=0 leakage reduced by stack 10T Bitcell Reduces Bitline Leakage Q QB [1] for iso-VDD, the 10T cell without M10 (a 9T cell) has 50% higher leakage current than the 6T, but adding M10 drops the overhead to 16%.
Leakage Power Savings with 10T Bitcell [1] • 6T memories in 65nm usually at 0.9V or greater (lowest reported is 0.7V) • 10T bitcell allows scaling to lower voltages • Lower voltage operation reduces leakage power dramatically for unaccessed cells
Bitline Leakage Limits Integration Level “1” Bit-line “0” “0” [1] 16 bitcells on bitline is best can hope for standard 6T
Cont’d BL leakage limits the number of cells on a BL. The 10T bitcell can sustain 256 cells/BL at 0.3V compared to 16 without M10 (6T or 9T). higher level of integration allowed by the 10T cell reduces the peripheral circuits and slightly mitigates the bitcell area overhead[1].
MC MC MC VDDon 10T Bitcell Allows Sub-VT Write To achieve write in sub-threshold, the virtual supply (VVDD) to the selected cells floats during the write operation VVDD RWL WL QB Q Folded WL shares VVDD BL RBL BLB MC [1]
feedback restores ‘1’ to VDD floating Cont’d Floating VDD weakens feedback and allows Write. A virtual supply voltage (VVDD) that floats during write allows robust write operation into sub-VT (mono-stable butterfly curve). VVDD stops floating while WL_WR remains asserted to restore the ‘1’value to full VDD[1].
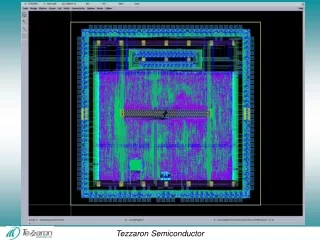
Test Chip Architecture • 256 rows and 128 columns per block • Static CMOS peripherals • Separate WL VDD for boosting • Assumed 1x1 redundancy • Simulation:Operates at 300mV across all process corners from 0 to 100oC [1]
256Kb 65nm Sub-VT memory Test chip addressing the sub-VT problems using 10T bitcell: 1.89mm by 1.12mm. Chip functions to below 400mV, holds without error to <250mV: At 400mV, 3.28mW and 475kHz at 27oC. Reads without error to 320mV (27oC) and 360mV (85oC). Write without error to 380mV (27oC) and 350mV (85oC). [1]
Simulation results Chip functioned correctly to below 400mV. Scope plot shows 300mV operation; at this low voltage, some bit errors were observed[1].
Power Measurements Relative to 0.6V 6T SRAM, 2.2X less leakage power at 0.4V and 3.3X less leakage power at 0.3V >60X less leakage power than 1.2V [1]
Active Energy Savings with 10T Bitcell 200MHz at 1.2V [1] 6T memories in 65nm usually at 0.9V or greater (lowest reported is 0.7V). Operating 10T bitcell at lower voltages saves energy. 10T memory can provide high frequency operation at higher voltages when necessary.
VDD Scaling Limits Read Bit Errors Redundancy and/or boosted WL account for mismatch 3 cols 2 cols 1 column (of 1024) 1x1 redundancy and WL boosting: Read works to 320mV Write works to 380mV 4 rows 1 row (of 2048) 5 rows [1] Write Bit Errors
Conclusions • Standard 6T approach limited to ~0.6-0.7V and 16 cells per bitline. • Proposed 10T bitcell shows sub-threshold operation with overall power and energy savings. • Sub-VT memory requires circuits and architectures to manage variability and low Ion/Ioff.
A read SNM free SRAM • decreases in Read SNM in conventional SRAM cells: • When SNM>0mV, stable data retention is still achieved even though the voltage at Node V1 may slightly exceed “0”. • When SNM<0mV, however, reversal data is overwritten. 1) Node V1 voltage greatly exceeds “0”. 2) Node V2 voltage falls below “1” because Node V1 voltage reaches the CMOS inverter logic threshold voltage (P2, N2). 3) The fall in Node V2 voltage raises Node V1 voltage further resulting in the overwriting of reversal data. [3]
Cont’d [3]
Proposed read SNM free SRAM N5 is added between Node V2 and NMOS transistor N2. When the cell is not accessed /WL is high and when the cell is accessed /wl is low. N5 prevents V2 from decreasing and thus the data bit is not reversed even if SNM equals zero. Period of /activation is less than V2 retention time. [3]
Cont’d A useless gap equal to one transistor results since 7 is a prime number. Solution: combining the SRAM cell and the sensing circuit. A PMOS and an NMOS transistor are placed, respectively, in GAP (P) and GAP (N), between two L-shaped SRAM cells. [3]
Measurement results Organization: Clock access time: Power consumption: Supply voltage: Process technology: Macro size: Cell size: 4Kword x 16b 1.2 ns, at 1.0 V 20 ns, at 0.5 V 12.9 mA/GHz, at 1.0 V 1.0V to 0.44 V 90-nm ASPLA CMOS, NMOS Vth: 0.32V, PMOS Vth: -0.33V 0.4 mm x 0.7 mm 2.09 μm2 (based on logic rules) Vdd-min decreases with increasing temperature. Vdd-min is determined by the write SNM, which, unlike Read SNM, improves with decreasing Vth levels in NMOS transistors, and Vth decreases with increasing temperature. [3]
SRAM macro layout and chip microphotograph Since both Write SNM and SRAM cell current improve with decreasing Vth levels in NMOS transistors, it is possible to achieve even higher-speed and lower- Vdd operations by reducing Vth levels below 0.32V, [3]
REFERENCES [1]. A 256kb Sub-threshold SRAM in 65nm CMOS Benton H. Calhoun, Anantha Chandrakasan Massachusetts Institute of Technology, Cambridge, MA ISSCC 2006 / SESSION 34 / SRAM / 34.4 [2]. Analyzing Static Noise Margin for Subthreshold SRAM in 65nm CMOS Benton H. Calhoun and Anantha Chandrakasan MIT, 50 Vassar St 38-107, Cambridge, MA, 02139 USA {bcalhoun,anantha}@mtl.mit.edu [3]. A Read-Static-Noise-Margin-Free SRAM Cell for Low-Vdd and High-Speed Applications ISCC 2005 / SESSION 26 / STATIC MEMORY / 26.3Koichi Takeda1, Yasuhiko Hagihara1, Yoshiharu Aimoto2, Masahiro Nomura1, Yoetsu Nakazawa1, Toshio Ishii2, Hiroyuki Kobatake