Download
1 / 6
100 likes | 347 Views
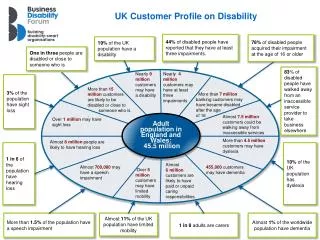
Hogan Lovells UK Diversity Profile . August 2012. Age. Sexual Orientation. 2%. 78%. UK - All - Diversity Profile. Gender. Ethnicity. 2%. 12%. 10%. 10%. 35%. 22%. 44%. 56%. 78%. 31%. 9. Flexible Working. Disability. 2%. 12%. 20%. 22%. 75%. 88%.

E N D
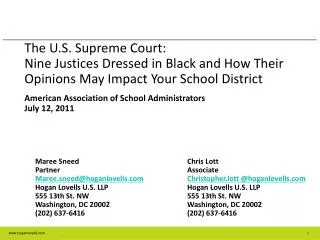
Hogan Lovells UK Diversity Profile August 2012
Age Sexual Orientation 2% 78% UK - All - Diversity Profile Gender Ethnicity 2% 12% 10% 10% 35% 22% 44% 56% 78% 31% 9 Flexible Working Disability 2% 12% 20% 22% 75% 88%
UK - Partners - Diversity Profile Age 2% 28% 26% 44% Gender Ethnicity 8% 20% 10% 80% 81% Disability Flexible Working Sexual Orientation 7% 1% 35% 38% 62% 64% 93%
UK – Associates & Other Legal - Diversity Profile 1% Gender Ethnicity Age 4% 6% 0% 10% 10% 46% 54% 46% 40% 84% Flexible Working Disability Sexual Orientation 3% 3% 8% 20% 23% 73% 77% 92%
UK - Trainees - Diversity Profile Age Gender Ethnicity 4% 3% 0% 56% 11% 44% 44% 56% 96% 86% Disability Flexible Working Sexual Orientation 1% 6% 3% 0% 8% 91% 91% 100%
UK – Business Services - Diversity Profile Gender Age Ethnicity 3% 13% 13% 22% 33% 14% 73% 67% 30% 32% Disability Sexual Orientation Flexible Working 2% 2% 19% 18% 21% 80% 82% 76%