Download

1 / 31
330 likes | 504 Views
Motion Graphs Review. Interpret The Graph Below:. Interpret The Graph Below:. The graph shows an object which is not moving (at rest). The distance stays the same as time goes by because it is not moving. Interpret The Graph Below:. Interpret The Graph Below:.

E N D
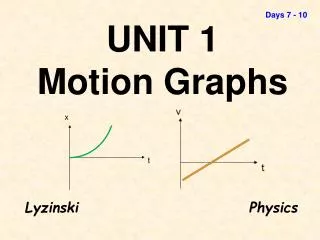
Interpret The Graph Below: The graph shows an object which is not moving (at rest). The distance stays the same as time goes by because it is not moving.
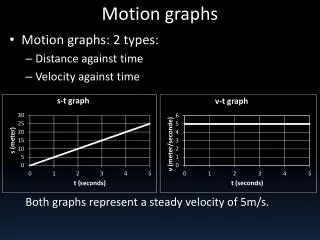
Interpret The Graph Below: The graph showsthat the object’s velocity does not change as time passes. It shows constant velocity.
Interpret The Graph Below: The graph showsthat the object’s distance increases as time passes.The object is moving and so it has a constant velocity. The straight line shows it is a constant velocity (not changing).
Interpret The Graph Below: The graph showsthat the object’s velocity is increasing as time passes – it is accelerating. The straight line shows that it is constant acceleration.
Interpret The Graph Below: A steeper line means a large distance moved in a given time. In other words it means higher speed. Both lines are straight so both are constant speeds
Velocity Interpret The Graph Below:
Interpret The Graph Below: Both lines show increasing speed (positive acceleration). The dashed line shows a greater constant acceleration. Velocity
Interpret The Graph Below: This graph shows an object moving with constant velocity. Distance is decreasing. The object is returning to the starting point. (This does not show slowing down.)
Interpret The Graph Below: Velocity (m/s)
Interpret The Graph Below: Velocity (m/s) This graph shows an object moving with decreasing velocity. The object is decelerating. (constant negative acceleration) Velocity is decreasing. The object is notreturning to the starting point.
Interpret The Graph Below: The curve in the graph shows that the object’s velocity is changing as time passes. The object is speeding up. This is positive acceleration.
Interpret The Graph Below: Velocity (m/s)
Interpret The Graph Below: The curve in the graph shows that the object’s acceleration is changing as time passes. It is no longer a constant acceleration. The curved line shows an increasing rate of acceleration over time. Velocity (m/s)
Interpret The Graph Below: In the first part of the graph the object is moving with fast constant velocity. In the second part of the graph the object is at rest (not moving). In the third part the object is again moving with slower constant velocity.
D x T S a c
D x T S a c
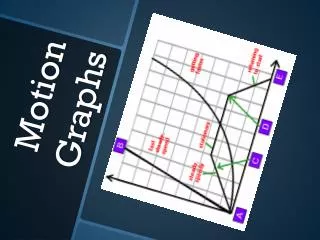
D x S T a c 12 m/s x 5s = 60 m 12 m/s - 0 m/s 4s 12 m/s - 12 m/s 5s 6 m/s - 12 m/s 2s 10 m/s - 6 m/s 4s
b-c + d-e - a-b e-f f-g 50 m - 40 m 15s 60 m - 60 m 10s 30 m - 60 m 10s 10 m - 10 m 10s 30 m 0 m