Download
1 / 18
180 likes | 194 Views
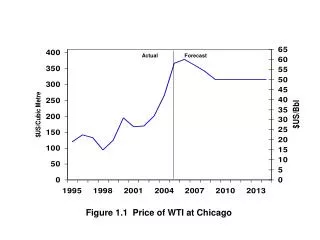
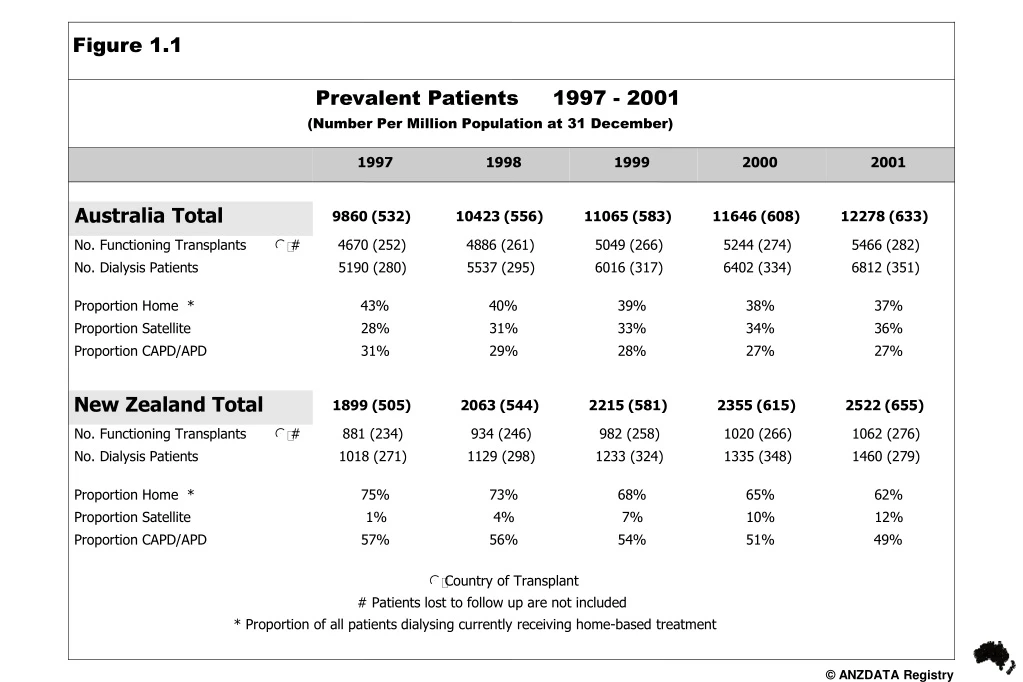
This figure illustrates the number of prevalent dialysis and transplant patients in Australia and New Zealand from 1997 to 2001. It includes data on new patients, transplant operations, deaths, and various treatment methods.

E N D
Figure 1.1 Prevalent Patients 1997 - 2001 (Number Per Million Population at 31 December) 1997 1998 1999 2000 2001 Australia Total 9860 (532) 10423 (556) 11065 (583) 11646 (608) 12278 (633) No. Functioning Transplants # 4670 (252) 4886 (261) 5049 (266) 5244 (274) 5466 (282) l No. Dialysis Patients 5190 (280) 5537 (295) 6016 (317) 6402 (334) 6812 (351) Proportion Home * 43% 40% 39% 38% 37% Proportion Satellite 28% 31% 33% 34% 36% Proportion CAPD/APD 31% 29% 28% 27% 27% New Zealand Total 1899 (505) 2063 (544) 2215 (581) 2355 (615) 2522 (655) No. Functioning Transplants # 881 (234) 934 (246) 982 (258) 1020 (266) 1062 (276) l No. Dialysis Patients 1018 (271) 1129 (298) 1233 (324) 1335 (348) 1460 (279) Proportion Home * 75% 73% 68% 65% 62% Proportion Satellite 1% 4% 7% 10% 12% Proportion CAPD/APD 57% 56% 54% 51% 49% Country of Transplant l # Patients lost to follow up are not included * Proportion of all patients dialysing currently receiving home-based treatment
Figure 1.2 Patient Flow Summary 1997 - 2001 (Number Per Million Population at 31 December) * Country of Transplant 1997 1998 1999 2000 2001 Australia Total Total New Patients 1483 (80) 1609 (86) 1747 (92) 1754 (92) 1883 (97) Total New Transplants * 502 (27) 518 (28) 453 (24) 530 (28) 540 (28) Living Donor Transplants 144 161 167 180 212 Subsequent Transplants 58 75 51 55 53 Total Deaths 910 1020 1074 1144 1228 Dialysis Patients 797 894 953 973 1079 Transplant Patients 113 126 121 171 149 New Zealand Total Total New Patients 320 (85) 371 (98) 375 (98) 420 (110) 458 (119) Total New Transplants * 112 (30) 106 (28) 112 (29) 106 (28) 110 (29) Living Donor Transplants 31 31 42 31 43 Subsequent Transplants 11 11 15 15 9 Total Deaths 184 203 214 271 284 Dialysis Patients 157 178 191 245 261 Transplant Patients 27 25 23 26 23
Prevalent Dialysis and TransplantsAustralia (at 31st December) Number of Patients 97 98 99 00 01
Prevalent Dialysis and TransplantsNew Zealand (at 31st December) Number of Patients 97 98 99 00 01
Figure 1.4 Prevalence and Incidence by Indigenous Origin, 1997 - 2001 (Number Per Million Population Per Year For New Patients) Aboriginal And Torres Strait Islanders Combined Race 1997 1998 1999 2000 2001 Australia New Patients 152 (386) 137 (340) 157 (382) 149 (356) 170 (398) Aboriginal Transplant Operations 22 (56) 28 (70) 23 (56) 18 (43) 21 (49) And Torres Functioning Transplants 96 (244) 105 (261) 117 (285) 119 (284) 122 (286) Strait Dialysis 439 (1114) 480 (1193) 531 (1293) 577 (1378) 617 (1445) Islanders Deaths 82 (208) 86 (214) 90 (219) 106 (253) 103 (241) New Zealand New Patients 109 (194) 130 (227) 109 (186) 128 (214) 146 (239) Transplant Operations 11 (20) 17 (30) 17 (29) 13 (22) 15 (25) Maori Functioning Transplants 85 (152) 93 (162) 100 (171) 100 (167) 103 (168) Dialysis 330 (589) 382 (666) 398 (679) 419 (700) 455 (744) Deaths 75 (134) 71 (124) 84 (143) 106 (177) 106 (173) New Patients 31 (148) 48 (222) 54 (242) 71 (309) 67 (283) Transplant Operations 4 (19) 7 (32) 8 (36) 4 (17) 6 (25) Pacific Functioning Transplants 41 (196) 41 (189) 42 (188) 42 (183) 44 (186) Islander Dialysis 160 (766) 181 (838) 205 (919) 251 (1091) 276 (1165) Deaths 15 (72) 26 (120) 26 (117) 23 (100) 36 (152)
Figure 1.5 National and State Stock and Flow 1-Jan-2001 to 31-Dec-2001 (31-Dec-2000 Figures) # Patients Lost to Follow-up are Not Included * Resident State Transplant Functioning Deaths Dialysis State New Patients Operations Transplants Total Dependent Dialysis Transplant * # * Queensland 330 (343) 123 (103) 203 (171) 31 (28) 1089 (1046) 1126 (1069) 2215 (2115) New South Wales 582 (534) 124 (135) 338 (345) 56 (73) 2304 (2150) 1592 (1568) 3896 (3718) Aust.Capital Territory 34 (40) 18 (24) 23 (21) 5 (1) 160 (162) 134 (125) 294 (287) Victoria 496 (438) 148 (131) 256 (230) 21 (28) 1851 (1707) 1332 (1263) 3183 (2970) Tasmania 38 (32) 11 (7) 28 (16) 3 (3) 124 (121) 113 (109) 237 (230) South Australia 153 (117) 58 (56) 60 (55) 16 (21) 433 (395) 599 (566) 1032 (961) Northern Territory 64 (53) 10 (11) 29 (34) 5 (4) 209 (178) 67 (64) 276 (242) Western Australia 186 (197) 49 (63) 142 (101) 12 (13) 642 (643) 514 (491) 1156 (1134) Australia 1883 (1754) 541 (530) 1079 (973) 149 (171) 6812 (6402) 5477 (5255) 12289 (11657) New Zealand 458 (420) 109 (106) 261 (245) 23 (26) 1460 (1335) 1051 (1009) 2511 (2344)
Figure 1.6 Prevalent Transplant and Dialysis Patients 1982 - 2001 Country of Transplant # Patients Lost to Follow-up are Not Included (Number Per Million Population at 31 December) Australia New Zealand Year Transplant # Dialysis Total Transplant # Dialysis Total 1982 1645 (108) 1836 (121) 3481 (229) 261 (82) 342 (107) 603 (189) 1983 1771 (115) 2019 (131) 3790 (246) 318 (99) 339 (105) 657 (203) 1984 1971 (127) 2152 (138) 4123 (265) 348 (107) 370 (113) 718 (220) 1985 2163 (137) 2230 (142) 4393 (279) 377 (115) 402 (122) 779 (237) 1986 2391 (150) 2339 (146) 4730 (296) 426 (129) 402 (122) 828 (250) 1987 2572 (158) 2526 (155) 5098 (314) 452 (135) 437 (131) 889 (266) 1988 2796 (169) 2675 (162) 5471 (331) 484 (145) 482 (144) 966 (289) 1989 3050 (181) 2751 (164) 5801 (345) 531 (158) 527 (156) 1058 (313) 1990 3262 (191) 2956 (173) 6218 (364) 579 (171) 557 (162) 1136 (331) 1991 3489 (201) 3138 (181) 6627 (382) 607 (175) 630 (182) 1237 (356) 1992 3696 (211) 3382 (193) 7078 (404) 677 (193) 674 (192) 1351 (384) 1993 3865 (219) 3703 (210) 7568 (429) 705 (198) 721 (203) 1426 (401) 1994 4055 (227) 4098 (230) 8153 (457) 731 (203) 784 (218) 1515 (421) 1995 4221 (234) 4522 (250) 8743 (484) 783 (214) 851 (233) 1634 (447) 1996 4429 (242) 4886 (267) 9315 (509) 823 (222) 935 (252) 1758 (473) 1997 4670 (252) 5190 (280) 9860 (532) 881 (234) 1018 (271) 1899 (505) 1998 4886 (261) 5537 (295) 10423 (556) 934 (246) 1129 (298) 2063 (544) 1999 5049 (266) 6016 (317) 11065 (583) 982 (258) 1233 (324) 2215 (581) 2000 5244 (274) 6402 (334) 11646 (608) 1020 (266) 1335 (348) 2355 (615) 2001 5466 (282) 6812 (351) 12278 (633) 1062 (276) 1460 (279) 2522 (655)
Figure 1.7 Comparison of Transplant and Dialysis Dependent Patients 1997 - 2001 (Number Per Million Population at 31 December) 1997 1998 1999 2000 2001 TRANSPLANTS * Queensland 944 (278) 992 (287) 1017 (290) 1069 (300) 1126 (310) New South Wales * 1509 (248) 1541 (250) 1558 (249) 1568 (250) 1592 (250) Aust. Capital Territory * 91 (186) 96 (196) 106 (215) 125 (253) 134 (266) Victoria 1108 (241) 1172 (251) 1206 (256) 1263 (265) 1332 (276) Tasmania 98 (207) 108 (229) 111 (236) 109 (232) 113 (240) South Australia 491 (332) 522 (351) 548 (367) 566 (378) 599 (399) Northern Territory 49 (262) 53 (279) 62 (321) 64 (327) 67 (339) Western Australia 394 (219) 415 (227) 454 (244) 491 (261) 514 (269) Australia 4684 (253) 4899 (261) 5062 (267) 5255 (274) 5477 (283) New Zealand 867 (231) 921 (247) 968 (254) 1009 (263) 1051 (273) * By Resident State and Country DIALYSIS Queensland 802 (236) 876 (253) 954 (272) 1046 (293) 1089 (300) New South Wales * 1855 (304) 1935 (314) 2069 (332) 2150 (342) 2304 (363) Aust. Capital Territory * 147 (300) 157 (321) 159 (323) 162 (327) 160 (318) Victoria 1324 (288) 1439 (309) 1595 (338) 1707 (358) 1851 (383) Tasmania 110 (232) 102 (216) 101 (215) 121 (257) 124 (264) South Australia 314 (212) 324 (218) 377 (252) 395 (264) 433 (288) Northern Territory 148 (791) 161 (847) 165 (855) 178 (911) 209 (1058) Western Australia 490 (273) 543 (296) 596 (320) 643 (341) 642 (336) Australia 5190 (280) 5537 (295) 6016 (317) 6402 (334) 6812 (351) New Zealand 1018 (271) 1129 (298) 1233 (324) 1335 (348) 1460 (379)
AustraliaPatients Per Million Transplanted patients lost to follow up have been excluded
New ZealandPatients Per Million Transplanted patients lost to follow up have been excluded
QueenslandPatients Per Million Transplanted patients lost to follow up have been excluded
New South WalesPatients Per Million Transplanted patients lost to follow up have been excluded
Australian Capital TerritoryPatients Per Million Transplanted patients lost to follow up have been excluded
VictoriaPatients Per Million Transplanted patients lost to follow up have been excluded
TasmaniaPatients Per Million Transplanted patients lost to follow up have been excluded
South AustraliaPatients Per Million Transplanted patients lost to follow up have been excluded
Northern TerritoryPatients Per Million Transplanted patients lost to follow up have been excluded
Western AustraliaPatients Per Million Transplanted patients lost to follow up have been excluded