Download
1 / 110
1.1k likes | 1.2k Views
PC Industry. Presented by Daniel Cheung, Kai Li Xiaotao Wang, Xiang Ren. The Players. Dell HP / Compaq Apple Gateway / eMachine Others. Market Shares. PC Sales by Region. Industry Performance. NASDAQ Computer Index (IXCO). Price Performance – 1 Year. Factors Affecting PC Industry.

E N D
PC Industry Presented by Daniel Cheung, Kai Li Xiaotao Wang, Xiang Ren
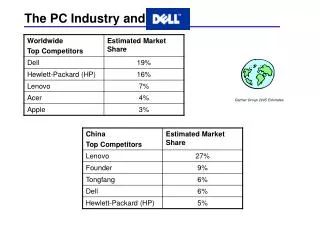
The Players • Dell • HP / Compaq • Apple • Gateway / eMachine • Others
Industry Performance • NASDAQ Computer Index (IXCO)
Factors Affecting PC Industry • Profit margin and parts cost • Upgrading cycle • Overall economical condition • Oversea markets
Industry Trends • Decline in desktop sales • Increase in mobile computing due to increase in wireless connectivity (25% worldwide and 30% in US) • Shifting toward digital home theater • Maturing of PC market
Business Model • Direct sales - Just In Time model, low inventory, direct to customer by phone & internet, lower cost and price • Resellers - Retail stores such as Future Shop, require inventory, higher cost and price
PC Brands VS Whitebox • What is Whitebox? - no name brand PC assemble by independent shops - used by more advance customers who like to customize individual parts - usually have less services compared to branded PC • Reaction from PC giants? - Dell’s XPS series, try to target gamers
HP History • Founded in 1939 by William R.Hewlett and David Packard. • Incorporated in 1947 under the laws of the State of California. • Changed the state of incorporation from California to Delaware in 1998.
Business Segment Information • The Personal Systems Group (PSG) • The Imaging and Printing Group (IPG) • Enterprise Storage and servers (ESS) • HP Services (HPS) • HP Financial Services (HPFS) • Software • Corporate Investments
Personal Systems Group • One of the leading vendors of personal computer in the world based on unit volume shipped and annual revenue. • Provides commercial PCs, consumer PCs, workstations, handheld computing devices, digital entertainment systems, calculators and other related accessories.
Imaging and Printing Group • The leading imaging and printing systems provider in the world for printer hardware, printing supplies and scanning device. • IPG's products can be categorized as home and business printing, imaging and publishing devices and systems, digital imaging products and printer supplies.
Enterprise Storage and Servers • Business Critical Servers • Industry Standard Servers • Storage
HP Financial Services • supports and enhances HP's global product and service solutions. • provides a broad range of value-added financial life cycle management services. • Offers leasing, financing, utility programs and asset recovery services, and financial asset management services for large global and enterprises customer.
HP Services • Technology Services • provide product warranty support. • Consulting and Integration • help customers measure, assess and maintain the link between business and IT. • Align, extend and manage customer’s applications and business processes. • Managed Services • offer IT management services, such as client computing managed services and managed web service.
Software • Provides management software solution • delivers a suite of comprehensive, carrier-grade platforms for developing and deploying next-generation voice, data and converged services • Focus on extending network-management software into application and business process management.
Business Strategic Imperatives • To provide customers with superior products, services and overall experiences by providing leadingedge technologies. • To deliver to business customers the best return on IT investments in the industry. • To build world class cost structures and processes across HP's entire portfolio of businesses. • To focus on innovation and research and development.
Production Distribution • Retailer - a party sell HP product to public through their own physical or internet store. • Resellers - a party sell HP product and service, frequently with their own value- added product or service to targeted customer groups. • Distribution partners - a party supply HP solution to small reseller with whom HP don’t have direct relationship • Independent distributor - a party supply HP products into geographies or customer segments in which HP have a lesser presence. • Original-equipment-manufactures (OEM) - a party integrate HP products with their own hardware or software and sell the integrated products.
Competition • Personal Systems Group • Dell, Toshiba, Apple, and China-based Lenovo Group • Imaging and Printing Group • Lexmark, Xerox, Epson, Sony, and Canon • Enterprise Storage and Servers • IBM, EMC, Dell, and Sun Microsystems • HP Services • IBM Global services and EDS Corporation
Income Statement Analysis For the fiscal year ended October 31 2004 2003 2002 2001 2000 1999 Total net revenue $79,905 $73,061 $56,588 $45,226 $48,870 $42,371 Total costs of Op 75,678 70,165 57,600 43,787 44,845 38,553 Net earnings 3,497 2,539 (903) 408 3,697 3,491 Net earnings/share 1.16 0.83 (0.36) 0.21 1.87 1.73
Income Statement Analysis • Revenue increased constantly form 1999 to 2004 • Earning from operation drooped from 2000 to 2002, then starting to increase from 2002 to 2004 • the reason of negative earning from operation in 2002 is that HP bought Compaq. It invested lots of money on this project. • Net earning follows the same pattern as earning from operation
2004 2003 2002 2001 2000 1999 Total asset 76,138M 74,716M 70,710M 32,584M 34,009M 35,297M Total Liability 38,574M 36,970M 34,448M 18,631M 19,800M 17,002M Total equity 37,564M 37,746M 36,262M 13,953M 14,209M 18,295M Return on equity 0.093 0.067 -0.0249 0.029 0.26 0.191 Price to book value equity 1.62 1.85 1.46 2.85 4.33 12.49 Net market value of shares 61038.64M 69892.20M 52839.20M 39765.36M 61457.17M 228539.45M Balance Sheet Analysis
Balance Sheet Analysis • The huge drop on Price to Book value equity from 1999 to 2000 is due to large dividend payoff at $15.59/share. • The larger the dividend payoff, the larger the stock price drop, because dividend payoff reduce the value of the company. • The negative Return on Equity is due to large payment to buy the Compaq • The Asset, Liability, and Equity has been doubled from 1999 to 2004
Value Driver • Imaging and Printing Group & HP Services • Contribute 96.5% of earning from operations on 2004 • Economies of scale • Second largest Market Capital in industry (Diversified Computer Systems industry) • Brand Recognition -Provide high quality products -Reliable services -Leading innovator in imaging and printing technology
Security Valuation • To evaluate the HP stock, we use FCFE discounted cash flow model: P(0)=FCFE*(0)(1+g)/(k-g) • From previous financial statement we can calculate the FCFE as: • FCFE=Cash flow from operation - Capital expenditures - Preferred dividends - Debt principal repayments + Proceeds of new debt issues • Therefore, the FCFE*(0) on 2004 is $1.6
Security Valuation • Some important data used for evaluating the HP stock • Beta of HP = 1.91 • Riskless return rate =4.55% (5 years Treasure bond) • Market expected return rate = 9.5% (S&P 500) • To calculate K, we use CAPM. • k= 4.55%+ 1.91(9.5%-4.55%) =14% • To calculate the growth rate g, we use past 5 years average net income growth rate. • g= 0.029
Security Valuation • Given: • Beta of HP = 1.9,Riskless return rate =4.55%, Market return rate = 9.5%, k=14%, g= 0.029, and FCFE*(0) = 1.6 • P(0)=FCFE*(0)(1+g)/(k-g) • P(0)= 1.6(1+0.029)/(0.14-0.029)=$14.83
The Application of Fisher • The Sales Growth and Product Development • Sales constantly grow over the year • Leading product innovator • Management Efficiency • Effective Management • Experienced Executive Team
The Application of Fisher • Competition • the competition is high • the second largest market capital in US Diversified Computer Systems industry • Shareholder’s Benefit Dilution • the positive net income can support HP's future growth without sacrificing the current shareholder’s benefit • Current Stock Price • median price (high potential to grow)
Recommendation • Hold the HP stock • Economies of scale • Constantly quarterly dividends pay out and dividend yield is great than Diversified Computer Systems industry’s average. • High profitability of HP services and imaging and printing group
apple It just works
History • Apple Computer, Inc. was incorporated in California, January 3, 1977 • One of the earliest company that make personal computers
Product • Macintosh line of desktop and laptop computer • Related software, services, and networking solutions • Portable digital music player • Xserve server and Xserve RAID storage products • Professional software applications • OS X operating system • iTunes Music Store • Support line
Business Strategy • Digital Hub (iPod, PDA, Camera) • Expanded Distribution (Own store) • Education (Free machine for school) • Creative Professionals (Final cut…)
Mac $1,799 - $2,999 $1,599 - $1,999 $2,399 - $3,999 $1,249 - $1,649 $629 - $899
Professional Software $1,499 $1,299 $599
iPod $379 - $499 $249 - $299 $129 - $169