Download
1 / 19
190 likes | 264 Views
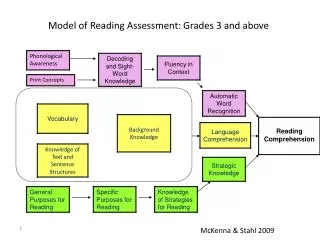
Modeling Reading Growth in Grades 3-5 with the Oregon Alternate Assessment. Dan Farley, Daniel Anderson, P. Shawn Irvin, Jessica L. Saven, & Gerald A. Tindal Behavioral Research & Teaching College of Education - UO. Funding Source.

E N D
Modeling Reading Growth in Grades 3-5 with the Oregon Alternate Assessment Dan Farley, Daniel Anderson, P. Shawn Irvin, Jessica L. Saven, & Gerald A. Tindal Behavioral Research & Teaching College of Education - UO
Funding Source Funds for the dataset used in this presentation came from a federal grant awarded to the UO from the U.S. Department of Education, Institute for Education Sciences: National Center on Accountability and Assessment for Special Education (NCAASE). U.S. Department of Education, Institute for Education Sciences (R324C110004). The opinions expressed are those of the authors and do not represent views of the Institute or the U.S. Department of Education.
Research Questions • What is the typical growth trajectory for SWSCD in reading across Grades 3-5 in Oregon? • How do individual SWSCD growth trajectories vary around the typical growth trajectory? • Do students with different disability classifications progress at significantly different rates?
Study Sample • 69% Male • 81% White • 16% with an ID • 19% with ASD • 20% with CD • 14% with OHI • 31% with SLD • 1,464 Oregon students • Participated in the Oregon AA-AAS Reading assessment in 2011, 2012, and/or 2013 • Typical grade level progressions
Oregon Reading AA-AAS • Assessment composed of 11 performance tasks (total of 60 items) • Scale is centered on 100 (range is typically between 60-140) • Reliability: • Internal consistency of measures was quite high: Cronbach’s α = .92, .95, and .96 for 2011, 2012, and 2013, respectively (ODE) • Validity: • Documentation framed by the work of Messick, with construct validity as the overall framework (ODE)
Study Methods • Nonlinear latent growth curve model with an estimated factor score (Kamata, Nese, Patarapichayatham, & Lai, 2013) • Growth was non-linear, with most growth occurring between grades 3 to 4 • Time measured in (0, 1, 1.31) • Maximum likelihood estimation with robust standard errors (MLR) • Robust to violations of multivariate normality • Mplus, Version 7.1 (Muthén & Muthén, 1998-2007)
Study Methods, cont. • Three alternate forms (spring 2011, 2012, 2013) • Calibrated to a common scale (in effect, students took the same test, with different performance expectations) • Missing data • Analyzed using Little’s Missing Completely at Random (MCAR) test with the MissMech R software package (Jamshidian, Jalal, & Jansen, 2014)
Study Methods, cont. • Used a random-effects pattern-mixture model to account for missingness in the data (Enders, 2011) • Effect sizes for the average growth between time points were computed (Bloom, Hill, Black, & Lipsey, 2008)
Study Results • Three models • Model 1: Unconditional • Model 2: Including static disability predictors • Model 3: Pattern-mixture model, including static disability predictors and missingness patterns • Model fit evaluated (Hu & Bentler, 1999; Kline, 2013) • Comparative Fit Index (CFI) > .95 • Root-Mean Square Error of Approximation (RMSEA) < .06 • Standardized Root Mean Square Residual (SRMR) < .08
SEM Model 3 Observed variables Latent Intercept & Slope Direct Effects Patterns of missingness Disability Predictors
Significant intercept differences across all disability categories except for ASD (all higher than reference group) Significant slope differences for CD and SLD (negative); ASD & OHI indistinguishable from reference group Only students missing G5 had significant growth differences based on missingness Only students missing G4 & 5 had significant intercept differences based on missingness
Conclusions • What is the typical growth trajectory for SWSCD in reading across Grades 3-5 in Oregon? • How do individual SWSCD growth trajectories vary around the typical growth trajectory? • Do students with different disability classifications progress at significantly different rates?
Discussion • First study on growth for SWSCDs to consider non-linear growth and include missingness patterns • Critical to include variables to account for group heterogeneity (i.e., disability) for this population • Conflicting evidence of which model fit the data better; both fit well • Missingness patterns need further exploration (adding in interactions)
Limitations • Disability classification was assumed as non-varying • Interpretation of the missingness pattern results was difficult, suggesting the possibility of an omitted variable • Modeling assumed that growth deceleration was consistent across all groups, but this was clearly not the case for students with ASD • We assumed that one assessment was sufficient to model growth across three years of content (including assumptions regarding the vertical articulation of standards and ALDs across this range)
References • Bloom, H. S., Hill, C. J., Black, A. R., & Lipsey, M. W. (2008). Performance trajectories and performance gaps as achievement effect-size benchmarks for educational interventions. New York: MDRC. • Buzick, H. M., & Laitusis, C. C. (2010). Using growth for accountability: Measurement challenges for students with disabilities and recommendation for research. Educational Researcher, 39, 537-544. • Enders, C. K. (2011). Missing not at random models for latent growth curve analyses. American Psychological Association, 16, 1-16. doi: 10.1037/a0022640 • Hu, L. & Bentler, P. M. (1999). Cutoff criteria for fit indexes in covariance structure analysis: Conventional criteria versus new alternatives. Structural Equation Modeling, 6(1), 1-55. • Kline, R. B. (2013). Assessing statistical aspects of test fairness in structural equation modeling. Educational Research and Evaluation, 19, 204-222. doi: 10.1080/13803611.2013.767624 • Jamshidian, M., Jalal, S., & Jansen, C. (2014). MissMech: An R package for testing homoscedasticity, multivariate normality, and missing completely at random (MCAR). Journal of Statistical Software, 56(6), 1-31. • Kamata, A., Nese, J. F. T., Patarapichayatham, C., & Lai, C. F. (2013). Modeling nonlinear growth with three data points: Illustration with benchmarking data. Assessment for Effective Intervention, 32, 105-116. • Muthén, L. K., & Muthén, B. O. (1998-2007). Mplus user's guide (Fifth ed.). Los Angeles, CA. • Oregon Department of Education. (2011-2013). 2010-13 technical reports: Oregon's alternate assessment system. Salem, OR: Behavioral Research and Teaching, University of Oregon. • United States Department of Education. (2015). ESEA Flexibility. Retrieved March 19, 2015, from http://www2.ed.gov/policy/elsec/guid/esea-flexibility/index.html
Thank You! • Dan Farley, Behavioral Research & Teaching • dfarley@uoregon.edu