Download
1 / 54
540 likes | 758 Views
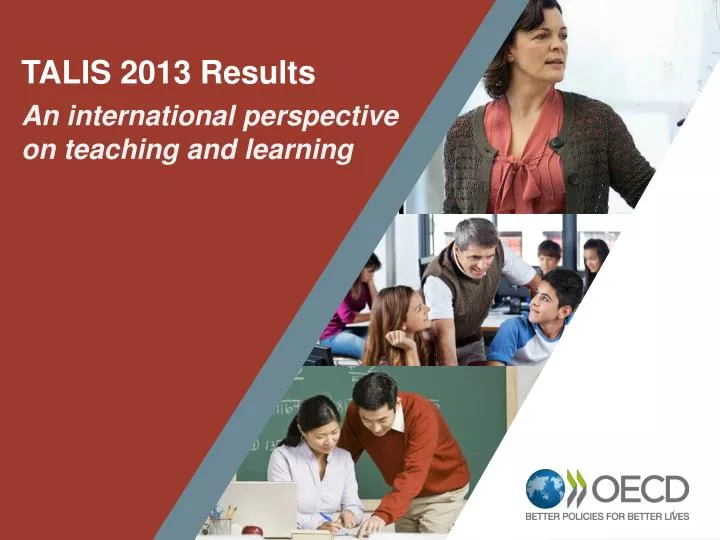
TALIS 2013 Results An international perspective on teaching and learning. 1. Mean mathematics performance, by school location, after accounting for socio-economic status. TALIS in Brief. 2. Fig II.3.3.

E N D
TALIS 2013 Results • An international perspective on teaching and learning 1
Mean mathematics performance, by school location, after accounting for socio-economic status TALIS in Brief 2 Fig II.3.3 Over 100 thousand randomly selected lower secondary teachers and their school leaders from over 6500 schools …representing more than 4 million teachers in 34 countries… …took an internationally-agreed survey about the working conditions and learning environments in their schools… …responding to questions about their background, their teaching practices, support and development, their relationships with colleagues and students and the leadership in their schools
Mean mathematics performance, by school location, after accounting for socio-economic status TALIS seeks to help with … • Recruit top candidates into the profession 3 3 Improve the societal view of teaching as a profession • Retain and recognise effective teachers – path for growth • Support teachers in continued development of practice Developing Teaching as a profession
Overview of TALIS • Improving Teaching Using Appraisal and Feedback • The Learning Environment: • Characteristics of Teachers and Schools • The Importance of School Leadership • Examining Teacher Practices and Classroom Environment • Teacher Self-Efficacy and Job Satisfaction: Why they Matter • Developing and Supporting Teachers
Principals’ working time 6 Average proportion of time lower secondary principals report spending on the following activities throughout the school year Average
Mean mathematics performance, by school location, after accounting for socio-economic status Elements not included in principals' formal education 7 Fig II.3.3 Percentage of lower secondary principals whose formal education did not include:
Mean mathematics performance, by school location, after accounting for socio-economic status Not everywhere where induction programmes are accessible do teachers use them 9 Fig II.3.3 Percentage of lower secondary teachers with less than 3 years experience at their school and as a teacher, who are working in schools with the following reported access to formal induction programmes, and their reported participation in such programmes
Mean mathematics performance, by school location, after accounting for socio-economic status Not everywhere where principals say mentoring is availabledo teachers have mentors 10 Fig II.3.3
Mean mathematics performance, by school location, after accounting for socio-economic status Teachers' needs for professional development 11 Fig II.3.3 Percentage of lower secondary teachers indicating they have a high level of need for professional development in the following areas
Mean mathematics performance, by school location, after accounting for socio-economic status Barriers to professional development participation 12 Fig II.3.3 Percentage of lower secondary teachers who "agree" or "strongly agree" that the following elements represent barriers to their participation in professional development activities
Mean mathematics performance, by school location, after accounting for socio-economic status Professional development recently undertaken by teachers by type and intensity 13 Fig II.3.3
Mean mathematics performance, by school location, after accounting for socio-economic status Participation in professional development and level of support received by teachers 14 Fig II.3.3
Mean mathematics performance, by school location, after accounting for socio-economic status Impact of professional development 15 Fig II.3.3 Regardless of the content, over 3/4 of teachers report that… • …the professional development in which they have participated has had a positive impact on their teaching.
Mean mathematics performance, by school location, after accounting for socio-economic status Teachers and feedback 17 Fig II.3.3 On average across TALIS countries, Just above half of the teachers report receiving feedback on their teaching from one or two sources ...and only one in 5 receive feedback from three sources.
Mean mathematics performance, by school location, after accounting for socio-economic status Emphasis placed on feedback 18 18 Fig II.3.3 Percentage of lower secondary teachers who report the feedback they received emphasised the following issues with a "moderate" or "high importance"
Mean mathematics performance, by school location, after accounting for socio-economic status Where feedback comes from 19 Fig II.3.3
Mean mathematics performance, by school location, after accounting for socio-economic status Teachers feedback : direct classroom observations 20 20 Fig II.3.3
Mean mathematics performance, by school location, after accounting for socio-economic status Teachers feedback : analysis of students' test scores 21 Fig II.3.3
Mean mathematics performance, by school location, after accounting for socio-economic status Teachers feedback : assessment of teacher content knowledge 22 Fig II.3.3
Mean mathematics performance, by school location, after accounting for socio-economic status Teachers feedback : never received 23 Fig II.3.3
Mean mathematics performance, by school location, after accounting for socio-economic status Impact of teacher appraisal and feedback systems in schools 24 Fig II.3.3 Percentage of lower secondary teachers who "agree" or "strongly agree" that :
Mean mathematics performance, by school location, after accounting for socio-economic status Consequences of feedback 25 25 Fig II.3.3 Percentage of lower secondary teachers who "agree" or "strongly agree" that:
Mean mathematics performance, by school location, after accounting for socio-economic status Feedback and change in behavior 26 26 Fig II.3.3 Percentage of lower secondary teachers who report a "moderate" or "large" positive change in the following issues after they received feedback on their work Professional Pedagogical Personal
Mean mathematics performance, by school location, after accounting for socio-economic status Outcomes of teacher feedback - Personal 27 27 Fig II.3.3 Percentage of lower secondary teachers who report a "moderate" or "large" positive change in the following issues after they received feedback on their work
Mean mathematics performance, by school location, after accounting for socio-economic status Outcomes of teacher feedback - Pedagogical 28 28 Fig II.3.3 Percentage of lower secondary teachers who report a "moderate" or "large" positive change in the following issues after they received feedback on their work Percentage of lower secondary teachers who report a "moderate" or "large" positive change in the following issues after they received feedback on their work
Mean mathematics performance, by school location, after accounting for socio-economic status Outcomes of teacher feedback - Professional 29 29 Fig II.3.3 Percentage of lower secondary teachers who report a "moderate" or "large" positive change in the following issues after they received feedback on their work
Distribution of class time 31 Average proportion of time lower secondary teachers report spending on each of these activities in an average lesson Average
Mean mathematics performance, by school location, after accounting for socio-economic status What teachers do beyond teaching 32 Fig II.3.3 Average number of 60-minute hours teachers report spending on the following tasks in an average week
Teacher co-operation 33 Percentage of lower secondary teachers who report doing the following activities at least once per month Exchange and co-ordination
Mean mathematics performance, by school location, after accounting for socio-economic status Teacher co-operation: Professional collaboration 34 Fig II.3.3 Percentage of lower secondary teachers who report never doing the following activities
Mean mathematics performance, by school location, after accounting for socio-economic status Teacher co-operation: Exchange and co-ordination 35 Fig II.3.3 Percentage of lower secondary teachers who report never doing the following activities
Mean mathematics performance, by school location, after accounting for socio-economic status Teachers' beliefs about teaching and learning 36 36 Fig II.3.3 Percentage of lower secondary teachers who "agree" or "strongly agree" that:
Mean mathematics performance, by school location, after accounting for socio-economic status Teaching practices 37 Fig II.3.3 Percentage of lower secondary teachers who report using the following teaching practices "frequently" or "in all or nearly all lessons"
Mean mathematics performance, by school location, after accounting for socio-economic status Teaching practices by country 38 38 Fig II.3.3 Percentage of lower secondary teachers who report using the following teaching practices "frequently" or "in all or nearly all lessons" Cumulative percentage of the three teaching practices is above 150%
Mean mathematics performance, by school location, after accounting for socio-economic status Teachers' use of student assessment practices 39 Fig II.3.3 Percentage of lower secondary teachers who report using the following methods of assessing student learning "frequently" or "in all or nearly all lessons"
Mean mathematics performance, by school location, after accounting for socio-economic status Reported use of methods of assessing student learning 40 40 Fig II.3.3 Percentage of lower secondary teachers who report using the following methods of assessing student learning "frequently" or "in all or nearly all lessons"
Mean mathematics performance, by school location, after accounting for socio-economic status Teachers' satisfaction with their working environment 42 42 Fig II.3.3 Percentage of lower secondary teachers who "agree" or "strongly agree" with the following statements
Mean mathematics performance, by school location, after accounting for socio-economic status Teachers' satisfaction with their profession 43 43 Fig II.3.3 Percentage of lower secondary teachers who "agree" or "strongly agree" with the following statements
Mean mathematics performance, by school location, after accounting for socio-economic status Teachers' satisfaction with their profession 44 44 Fig II.3.3 Percentage of lower secondary teachers who "agree" or "strongly agree" with the following statements
Mean mathematics performance, by school location, after accounting for socio-economic status Teachers' perceptions of the value of teaching 45 45 Fig II.3.3 Percentage of lower secondary teachers who "agree" or "strongly agree" that teaching profession is a valued profession in society Above-average performers in PISA
Mean mathematics performance, by school location, after accounting for socio-economic status Countries where teachers believe their profession is valued show higher levels of student achievement 46 46 Fig II.3.3 Relationship between lower secondary teachers' views on the value of their profession in society and the country’s share of top mathematics performers in PISA 2012 R2 = 0.24 r= 0.49
Mean mathematics performance, by school location, after accounting for socio-economic status Countries where teachers believe their profession is valued show higher levels of student achievement 47 47 Fig II.3.3 Relationship between lower secondary teachers' views on the value of their profession in society and the country mean score in mathematics in PISA 2012 R2 = 0.15 r= 0.38
Mean mathematics performance, by school location, after accounting for socio-economic status Relationship between the value of the teaching profession and the share of low mathematics performers 48 48 Fig II.3.3 Relationship between lower secondary teachers' views on the value of their profession in society and the country’s share of low mathematics performers in PISA 2012 R2 = 0.06 r= 0.23
Mean mathematics performance, by school location, after accounting for socio-economic status Value of teaching and job satisfaction 49 Fig II.3.3 Percentage of lower secondary teachers who "agree" or "strongly agree" with the following statements
Mean mathematics performance, by school location, after accounting for socio-economic status Drivers of job satisfaction 50 Fig II.3.3 The more frequently that teachers report participating in collaborative practices with their colleagues, the higher their level of self-efficacy. The same is true for job satisfaction.