Download
1 / 11
110 likes | 291 Views
AP STATS: Warm-Up. Do Math SAT scores help to predict Verbal SAT scores. Make a scatter plot. Find the least squares regression and r and r-squared . Also graph the residuals. Use L3 (Y1(L1)) and L4 (L2-L3) to do so. Plot L1 vs. L4. What is a residual?

E N D
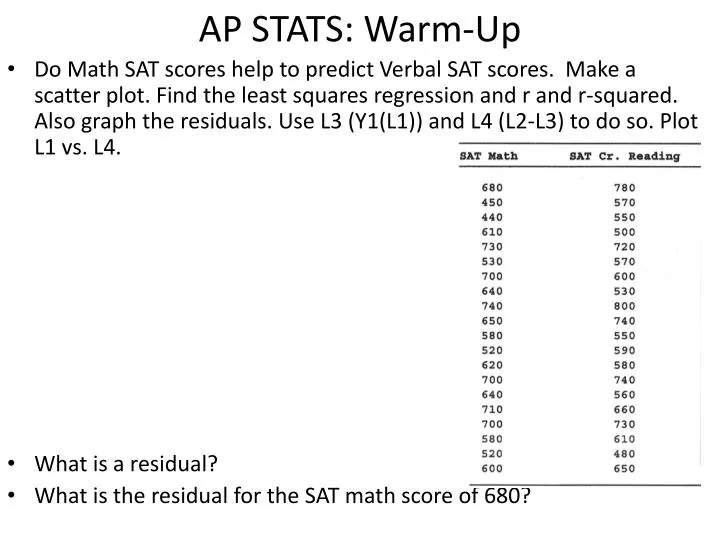
AP STATS: Warm-Up • Do Math SAT scores help to predict Verbal SAT scores. Make a scatter plot. Find the least squares regression and r and r-squared. Also graph the residuals. Use L3 (Y1(L1)) and L4 (L2-L3) to do so. Plot L1 vs. L4. • What is a residual? • What is the residual for the SAT math score of 680?
Agenda: • Today: R-Squared • Wednesday: Quiz on 3.2 and intro to 3.3 • Thursday: 3.3 Lurking Variables/Review • Friday: No Class (half day) • Monday: Quiz on 3.3 – and Review for the Chapter 3 Test • Tuesday (11/5): Chapter 3 Test • Wednesday: DROP • Thursday (11/7): Project 2 is Due • Friday (11/8): No Class (Parent-Teacher Conferences)
Idea of the Day: Regression towards the mean. • Named after Sir Francis Galton. • He found that the kids of taller-than-average parents tend to be taller on average, but not as tall their parents. Hmmm… • I will post a chapter from a book called “Thinking Fast and Slow” by Daniel Kahneman about this. It’s a really interesting idea. • This explains why athletes having a spectacular year tend to do poorly the next year and why sick people tend to get better (regardless of the type of treatment).
Some Notes on the Project: -Be formal and scientific in your writing (for the most part). i.e. don’t say “I have no clue.” Try to avoid being colloquial. -Summarize your descriptive stats (mean, median, middle 50%) in the results (if it is relevant). Actually restate the numbers here that are relevant and meaningful. -Print and edit. It’s the only way to catch blunders. -Be explicit in your method. Who did you ask, what was your question, how did you conduct the study? -No need to comment on which graph looks best (i.e. a histogram versus a boxplot). By choosing the graph, the reader can assume that you chose wisely. -Choose graphs wisely. What are you trying to show? What type of display shows this result best? -Make subheadings for each part of your paper (intro, method, results, conclusion). -Be careful in drawing conclusions. Just because you see a difference doesn’t mean that it’s conclusive evidence (we need more formal ways to analyze data before we can make those claims sometimes).
The role of r2 in regression r2 – also known as the coefficient of determination. -It is true that r2 is the square of r, but there is more to the story. The big idea of r2: How much better is the least squares line at predicting responses (y) than if we just used y-bar (the mean) as our prediction of every point. **r measures the strength of a linear relationship and r2 tells you how much better the linear model is at predicting y-values than simply using y-bar (the mean of y).
Saying it in words. • Say that the r2 for a car’s age versus the value of the car is 45%. • This means that 45% of the variation in a car’s value is explained by the least squares regression line relating car age to car value. • SIMPLY PUT: it is the percentage of the response variable variation that is explained by a linear model.
Formula for r2 • SST = • SSE = Total sum of Squares Sum of Squared Errors (i.e. the sum of the residuals squared) The fraction of the variation in the values of y that is explained by the least squared regression on the other variable.
Facts about Least Squares Regressions • The distinction between explanatory and response variable is essential in regression. You will get a different regression line if you reverse the variables. • Recall that the least square regression line always passes through (x-bar, y-bar)
You Try! 3.44) A study of class attendance and grades among first year students at a state university showed that in general, students who attended a higher proportion of their classes earned higher grades. Class attendance explained 16% of the variation in grade index among the students. What is the numerical value of the correlation between between percent of classes attended and grade index?
Classwork/Homework 23 • Read the section 3.2 review • Complete 3.43, 3.53, 3.55. • Optional: 3.58 (a bit tricky).