Download
1 / 28
280 likes | 405 Views
New Wind Maps and Resource Potential Estimates for the United States. Michigan Wind Working Group Webinar Dennis Elliott, Marc Schwartz, Donna Heimiller, Steve Haymes – NREL Michael Brower – AWS Truewind , LLC March 31, 2010. Presentation Outline. Overview

E N D
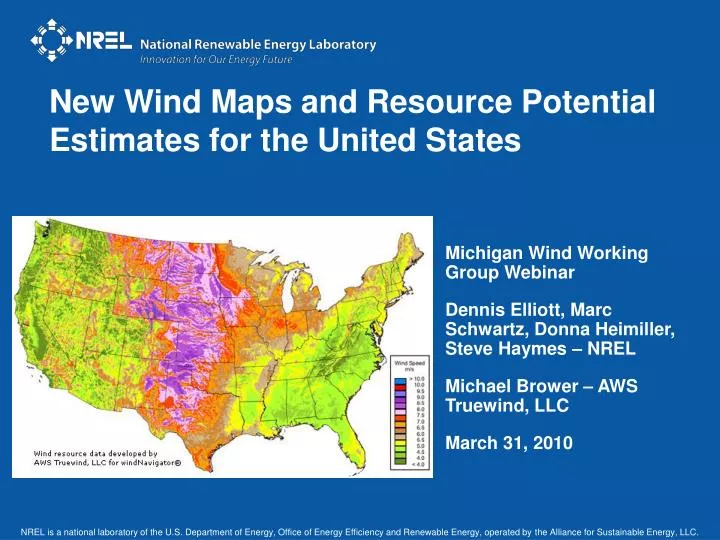
New Wind Maps and Resource Potential Estimates for the United States Michigan Wind Working Group Webinar Dennis Elliott, Marc Schwartz, Donna Heimiller, Steve Haymes – NREL Michael Brower – AWS Truewind, LLC March 31, 2010
Presentation Outline • Overview • History of wind maps and resource potential estimates • AWS Truewind methodology and involvement with NREL • NREL’s validation of AWS Truewind model data • Development of wind potential estimates – data and methods • Wind potential - key findings • Comparison to previous studies • Conclusions
Overview • Significance of this project: • New wind energy potential estimates for contiguous United States and each state at 80-m and 100-m heights • First comprehensive update of the U.S. wind potential in almost two decades • Based on very high-resolution (200-m resolution) wind resource data • Capacity factor (representative of power output from large wind turbines), instead of power classes (theoretical energy in the wind), to develop wind potential estimates • Excluded areas unlikely to be developed • Major products developed for contiguous U.S. and each state: • Mean wind speed maps at 80-m height • Charts of wind potential at 80-m and 100-m heights in MW of installed capacity as a function of capacity factor (not adjusted for losses) • Tables of windy land area and wind potential at 80-m and 100-m heights for various capacity factor ranges. Wind potential in MW (or GW) of installed capacity and annual generation in GWh. • Available on web link: http://www.windpoweringamerica.gov/wind_maps.asp • Development of products: • Collaborative project between NREL and AWS Truewind • Supported by U.S. Department of Energy’s Wind Powering America program
Wind Resource Potential - United States Capacity factor (CF) example: 1 MW turbine at 30% CF = 300 kW per year of output
History of U.S. Wind Maps and Potential Estimates • 1979-1987: First comprehensive U.S. wind resource assessment, culminating in the U.S. Wind Resource Atlas • Wind power class maps at 50-m height (about 25-km spatial resolution) • Based largely on weather station data and limited tower data • 1990-1993: First detailed analysisof U.S. wind potential, resulting in national and state wind potential estimates • Estimates of land area and wind potential by power class at 50m • Based on wind power class maps from 1987 U.S. Wind Atlas and landform classification maps • Excluded sensitive environmental lands and incompatible land-use areas • 2001-2008:High resolution (1-km or finer) wind power maps at 50m for 39 states and updated wind potential for selected states • Numerical modeling by AWS Truewind and validation by NREL and consultants • WPA program with co-funding by states and other organizations • 2009-2010:Wind speed maps and potential estimates at 80-m and 100-m heights for contiguous U.S. and each state • Collaborative project between NREL and AWS Truewind • Estimates of land area and wind potential by capacity factor ranges
Michigan Wind Map Changes Over Time 1987 & 2004 Wind Power Maps at 50 m 2010 Wind Speed Map at 80 m
Michigan Offshore Wind Resource Map at 90 m • Highest speeds close to shore are located: • In Lake Michigan along west shoreline of state • In Lake Superior near Keweenaw Peninsula • Shallow water areas with good wind resource are located: • In Saginaw Bay • In Lake Huron east of the Thumb
Model Validation- Method • NREL’s validation of model 80 m wind speed • Purpose was to identify gross disagreements between model 80 m wind speed and measured data • Model wind speeds provided to NREL by AWS Truewind • Capacity factor estimates not included in this analysis • Validation limited to 19 key WPA states • 6 Western (OR, WA, ID, NV, UT, AZ) • 6 Midwestern (MO, IL,WI, IN, MI, OH) • 7 Eastern/Appalachian (NY, NJ, PA, MD, WV, KY, TN) • Average wind speed from towers were compared to model wind speed values • Time series of wind speed data from the towers were not analyzed
Model Validation- Tower Information • Tower information from over 1600 sites was provided to NREL • Approximate location, highest measurement level, wind speeds at highest level and at 80 m, shear exponent, and period-of-record • NREL defined the subset of 304 towers in the 19 states used in the analysis • Almost all towers were from proprietary sources • Data from towers 45 m and higher were analyzed • About 20 towers had measurement levels greater than 60 m • About 80 towers had easily identifiable periods-of-record of 2 years and longer
Model Validation- National Results • No gross differences were found between measured and model 80 m data that would preclude these data from being used for wind potential estimates • Regions where additional measurements are crucial • Ridge crest sites in northeastern U.S. • Interior sites in western U.S. • National network of measurements at turbine hub- heights is needed in order to estimate wind potential with even greater accuracy
Model Validation- Michigan Results • Tower information from 28 sites in Michigan provided to NREL • All towers were from proprietary sources • Data from towers 45 m and higher were analyzed • One tower had measurements at 80 m • The other 27 towers were 45 m to 60 m in height • Four towers had easily identifiable periods-of-record of 2 years and longer • Comparison of model and measurement wind speeds: • Model lower than measurements at towers near Saginaw Bay and western side of “Thumb” • Model higher than measurements in other regions of state • Model validation uncertainty • Many towers were on open farmland but near heavily treed areas • Not clear whether positive bias is due to model overestimation of wind speed or underestimation of wind shear • No modifications to model wind speeds for Michigan were made
Development of Wind Potential Estimates • AWS Truewind produced a national dataset of estimated gross capacity factor (not adjusted for losses) • Spatial resolution of 200 m • Heights of 80 m and 100 m • Land-based areas only (no offshore), 48 contiguous states • NREL used the gross capacity factor (CF) data to estimate the land area and wind potential as a function of CF for each state and U.S. • Windy land defined as areas with >= 30% CF, which are generally considered to be suitable for wind energy development • Areas with CF >=30% have mean annual wind speeds of about 6.4 m/s and greater • Excluded sensitive environmental lands and incompatible land-use areas (details to follow) • For wind potential, assumed 5 MW/km2of installed nameplate capacity • Wind potential expressed in two ways • Installed capacity in MW • Annual generation in GWh
Wind Potential Exclusion Methodology • NREL has developed a set of national exclusions based on consultation with industry and internal expertise • Utilize data available nationally and apply consistently across the U.S. • Eliminates potentially sensitive environmental lands • National Park Service administrated areas • Fish and Wildlife administrated areas • Other categories such as inventoried roadless areas, wilderness areas, national recreation areas. • Eliminate incompatible land use areas for land based development • Urban areas and airports • Water and wetland features • Consideration of alternate use or difficulty in development – 50% exclusions • USFS and Department of Defense lands • Non-ridgecrest forest lands
Michigan Areas Excluded from Developable Wind Potential • 1) Potentially sensitive environmental lands: • - National Park Service and Fish and Wildlife Service • - Wildlife, wilderness, recreation areas, and other specially designated areas on federal land • - State and private environmental lands where data was available • - Half of the remaining U.S. Forest Service and Department of Defense lands • 2) Potentially incompatible land use: • - Urban areas, airports, wetlands and water bodies • - Half of non-ridge crest forested areas • 3) Other factors: • - Slopes greater than 20% • - A 3 kilometer area surrounding environmental and land use excluded areas (except water bodies) Excluded 40% of the windy land >= 30% gross capacity factor at 80 m Excluded 44% of the windy land >= 35% gross capacity factor at 80 m
Results of Exclusions – Example • Results represent the application of nationalized, relatively conservative exclusion scenario using national scale data • Total windy land reported to represent full state potential • Additional analysis could be done to present results by type of exclusion, or utilizing state-specific exclusion scenarios
Wind Potential – Key Findings • U.S. wind potential from areas with CF>=30% is enormous: • At 80 m, almost 10,500 GW capacity and 37 million GWh of annual generation • At 100 m, 12,000 GW capacity and nearly 45 million GWh of annual generation • Most of the wind potential comes from the windy central regions, but many eastern and western states have significant wind potential. • 35 states more than 1000 MW capacity at 80 m • 38 states more than 1000 MW capacity at 100 m • Even for higher CF ranges at 80 m, the U.S. wind potential is quite large: • CF>=35%, more than 8000 GW and 28 states >1000 MW • CF>=40%, more than 5500 GW and 19 states >1000 MW
Michigan – Wind Map and Potential • Michigan wind potential from areas with CF>=30% is substantial: • At 80 m, 59,000 MW capacity and 169,000 GWhof annual generation • At 100 m, 179,000 MW capacity and 523,000 GWhof annual generation • Even for higher CF ranges at 80 m, the Michigan wind potential is quite large: • CF>=35%, about 11,600 MW • CF>=40%, almost 400 MW
Comparison to Previous Studies • Previous national wind potential estimates in early 1990s versus new estimates in 2010 • New estimates for CF>=30% at 80 m height and old estimates for >=Class 3 at 50 m • New estimate (37 million GWh/yr) more than 3 times old estimate (11 million GWh/yr). For Michigan, new estimate is 2.6 times old estimate. • New windy land area estimate about twice the old estimate. For Michigan, new estimate is 1.7 times old estimate. • Previous estimates based on: • Wind power class maps at 50 m and 25-km spatial resolution from 1987 U.S. Wind Atlas • Old wind turbine technology, assumed 25% efficiency and 25% losses • Fairly restrictive land-use exclusions, e.g. excluded 30% agricultural lands • New estimates based on: • Capacity factor map data at 80 m and 100 m and 200-m spatial resolution from advanced numerical computing and more 1600 measurement sites • New wind turbine technology, using composite power curves from large utility-scale wind turbines to estimate capacity factor • Detailed GIS data sets for environmental and land-use exclusions. Exclusions updated by input from national experts, e.g., no agricultural exclusions. • Wind resource classification different between old and new studies • Power classes represent theoretical energy in the wind • Capacity factor represents power output from large wind turbines • Wind resource greater at 80 m than at 50 m due increase of wind resource with height
Capacity Factor vs Wind Speed and Power Mean Wind Speed (WS) and Wind Power Density (WPD) as functions of Capacity Factor and Weibull k Weibull k
Variation of Wind Power Class and Capacity Factor Mean wind speed = 7.0 m/s but different Weibull k • California wind corridor • Weibull k = 1.5, Power Class = 5, Capacity Factor = 35% • Eastern U.S. • Weibull k = 2, Power Class = 4, Capacity Factor = 36% • Midwest U.S. • Weibull k = 2.5, Power Class = 3, Capacity Factor = 36% • Specific areas • Weibull k = 3, Power Class = 2, Capacity Factor = 35% Note: Capacity factors are rounded to the nearest whole percent
Conclusions • NREL has developed, through a joint project with AWS Truewind LLC, updated wind potential estimates for each of the 48 contiguous states and an updated national total • The potential estimates are based on Capacity Factor categories at 80 m and 100 m above ground • The results show that the contiguous United States has enormous wind potential: For areas with CF>=30% • At 80 m, almost 10,500 GW capacity and 37 million GWh of annual generation • At 100 m, 12,000 GW capacity and nearly 45 million GWh of annual generation • 35 states more than 1000 MW capacity at 80 m • 38 states more than 1000 MW capacity at 100 m • Michigan wind potential from areas with CF>=30% is substantial: • At 80 m, 59,000 MW capacity and 169,000 GWh of annual generation • At 100 m, 179,000 MW capacity and 523,000 GWh of annual generation • Michigan wind potential is quite large even for higher CF ranges at 80 m: • CF>=35%, about 11,600 MW • CF>=40%, almost 400 MW