Download
1 / 25
250 likes | 339 Views
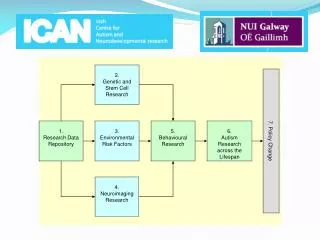
abstract. Under the hood of 3TU.Datacentrum, a repository for research data. Egbert Gramsbergen TU Delft Library / 3TU.Datacentrum e.f.gramsbergen@tudelft.nl. ELAG, 2012-05-17. 3TU.Datacentrum. 3 Dutch TU’s: Delft, Eindhoven, Twente Project 2008-2011, going concern 2012- Data archive

E N D
abstract Under the hood of 3TU.Datacentrum,a repository for research data. Egbert Gramsbergen TU Delft Library / 3TU.Datacentrum e.f.gramsbergen@tudelft.nl ELAG, 2012-05-17
3TU.Datacentrum • 3 Dutch TU’s: Delft, Eindhoven, Twente • Project 2008-2011, going concern 2012- • Data archive • 2008- • “finished” data • preserve but do not forget usability • metadata harvestable (OAI-PMH) • metadata crawlable (OAI-ORE linked data) • data citable (by DataCite DOI’s) • Data labs • Just starting • Unfinished data + software/scripts
Technology • FedoraRepository software • THREDDS / OPeNDAPRepository software ? http://commons.wikimedia.org/wiki/File:Engine_of_Trabant_601_S_of_Trabi_Safari_in_Dresden.jpg
Fedora digital objects XML container with “datastreams” containing / pointing to (meta)data • 3 special RDF datastreamsindexed in triple store-> query with REST API / SPARQL • Any number of content datastreams xml datastreams may be inline,other datastreams are on a location managed by Fedora
Fedora Content Model Architecture Content Model object: links to Service Definition(s)optionally defines datastreams + mime-types Service Definition object: defines operations (methods) on data objectsincl parameters + validity constraints Service Deployment object: implements the methodsRequests are handled by some service whose location is known to the Service Deployment URL:/objects/<data object pid>/methods/<service definition pid>/<method name>[?<params>]
Fedora API & Saxon xslt2 service API’s for viewing and manipulating objects View API (REST, GET method) • findObjects • getDissemination • getObjectHistory • listDatastreams • risearch (query triple store (ITQL, SPARQL)) • … So everything has a url and returns xml All methods so far have to return xml or (x)html • xslt is a natural fit(remember: you can easily open secondary documents aka use the REST API) • xslt2.0 is much more powerful than xslt1.0 • With Saxon, you can use Java classes/methods from within xslt(rarely needed, in 3TU.DC only for spherical trigonometry in geographical calculations)
3TU.DC architecture • Saxon for: • html pages • rdf for linked data (OAI-ORE) • KML for maps • Faceted search forms • csv, cdl, Excel for datasets • xml for indexing by SOLR • xml for Datacite • xml for PROAI • … and more • Not in picture: • PROAI (OAI-PMH service provider) • DOI registration (Datacite)
3TU.DC architecture [2] • Content Model Architecture and xslt’s in detail • 10 content models • 7 service definition objects with 19 methods • 14 service deployment objects using 32 xslt’s Left to right: content models, service deployments, methods aka xslt’s, service definitions Lines: CMA, xslt imports, xml includes . All xslt’s are datastreams of one special xslt object.
rdf relations in 3TU.DC Example relations (namespaces are omitted for brevity)
UI as rdf / linked data viewer This dataset has some metadata and is part of this dataset with these metadata It was calculated from this dataset with these metadata measured by this instrument with these metadata
UI as rdf / linked data viewer [2] • Dilemmas - how far will you go? • Which relations must be expanded? • How many levels deep? • Which inverse relations will you show? • Show repetitions? • Answer: trial and error • Set of rules for each type of relation • Show enough for context but not too much… it’s a delicate balance
Reminder What about this part?
NetCDF NetCDF: data format + data model • Developed by UCAR (University Corporation for Atmospheric Research, USA), roots at NASA, 1987. • Comes with set of software tools / interfaces for programming languages. • Binary format, but data can be dumped in asci or xml • Used mainly in geosciences (e.g. climate forecast models) • BUT: fit for almost any type of numeric data + metadata • Core data type: multidimensional array >90% of 3TU.DC data is in NetCDF
NetCDF [2] Example: T(x,y,z,t) - what can we say in NetCDF? Variable T (4D array) Variablesx,y,z,t (1D arrays) Dimensionsx,y,z,t Attributes: creator=‘me’ Attributes: x.units=‘m’, y.units=‘m’, z.units=‘m’, t.units=‘s’, T.units=‘deg_C’ T.name=‘Temperature’, T.error=0.1, etc… You may invent your own attributes or use conventions (e.g. CF4) newer NetCDF versions: • More complex / irregular / nested structures • built-in compression by variableboost compression with “leastSignificantDigit=n”
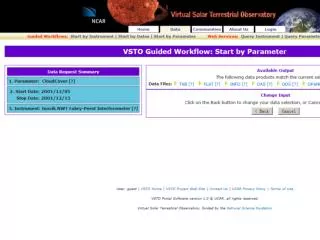
OPeNDAP OPeNDAP: protocol to talk toNetCDF (and similar) data over internet THREDDS: server that speaks OPeNDAP • Internalmetadatadirectlyvisible on site • APIs for all main programming languages • Queriestoobtain: • cross-sections (slices, blocks) • samples (take only 1 in n points) • aggregated datasets (e.g. gluetogetherconsecutive time series)Queries are handled server-side(Datafiles in 3TU.DC are up to 100GB)
OPeNDAP python example import urllib import numpy as np import netCDF4 import pydap import matplotlib import matplotlib.pyplot as plt import pylab from pydap.client import open_url year = '2008' month = '08' myurl = 'http://opendap.tudelft.nl/thredds/dodsC/data2/darelux/maisbich/Tcalibrated/‘ +year+'/'+month+'/Tcalibrated'+year+'_'+month+'.nc' dataset = open_url(myurl) # make connection print dataset.keys() # inspect dataset T = dataset['temperature'] # choose a variable print T.shape # inspect the dimensions of this variable T_red = T[:2000,:150] # take only a part T_temp = T_red.array T_time = T_red.time T_dist = T_red.distance mesh = plt.pcolormesh(T_dist[:],T_time[:],T_temp[:]) # let’s make a nice plot mesh.axes.set_title('water temperature Maisbich [deg C]') mesh.axes.set_xlabel('distance [m]') mesh.axes.set_ylabel('time [days since '+year+'-'+month+'-01T00:00:00]') mesh.figure.colorbar(mesh) mesh.figure.savefig('maisbich-'+year+'-'+month+'.png') mesh.figure.clf()
OPeNDAP catalogs Datasets are organized in catalogs (catalog.xml) • Usually (not necessarily) maps to folder • Contains location, size, date, available services of datasets Catalogs are our hook to Fedoracatalog.xml Fedora object
Typical bulk ingest For predictable data structures (e.g. a 2TB disk with data delivered every 3 month structured in a well-agreed manner):
Bulk ingest from datalab [future?] Less predictable data structures (e.g. datalab which raises barrier after embargo period):
THE ENDQQ? data.3tu.nl
Cabauw/IDRA data • Rain & drizzle radar data • Tobias Otto & Herman Russchenberg, TUD/EWI • “IDRA provides the horizontaldistribution of reflectivity, mean Doppler velocity, Doppler spectrum width and polarimetric parameters likedifferentialreflectivity, lineardepolarization ratio or specificdifferentialphase.” • Radar range: near (1.5 km), standard (15 km), far (60 km) • Raw data: usually 1 min/hour stored, ~ 1 GB each • Processed data: 1 file per range, total 1 day ~ 2 GB • quickview.nc: summary of day in efficient format (int16 for each minute)provides per minute: range (1 of 3), rain level (1 of 4), raw data yes/no. • Picture generated from quickview.nc, for human consumption • ~ 7.5 TB/year
Aggregated datasets (time series) <?xmlversion="1.0" encoding="UTF-8"?> <catalogxmlns="http://www.unidata.ucar.edu/namespaces/thredds/InvCatalog/v1.0" version="1.0.2" name="coolbox" xmlns:n="http://www.unidata.ucar.edu/namespaces/netcdf/ncml-2.2" xmlns:xlink="http://www.w3.org/1999/xlink" xmlns:xsi="http://www.w3.org/2001/XMLSchema-instance" xsi:schemaLocation=“ http://www.unidata.ucar.edu/namespaces/thredds/InvCatalog/v1.0 http://www.unidata.ucar.edu/schemas/thredds/InvCatalog.1.0.2.xsd"> <service name="all" base="" serviceType="compound"> <service name="odap" serviceType="OpenDAP" base="/thredds/dodsC/"/> </service> <dataset name="time-aggregated data" ID="agg/darelux/maisbich/Tcalibrated/all" urlPath="agg/darelux/maisbich/Tcalibrated/all"> <metadatainherited="true"> <serviceName>odap</serviceName> </metadata> <n:netcdf> <n:attribute name="title" value="Maisbich (Luxemburg) calibrated Distributed Temperature Sensing (DTS) data" type="String"/> <n:aggregationdimName="time" type="joinExisting" timeUnitsChange="true“> <n:scanlocation="/data2/opendapstore/darelux/maisbich/Tcalibrated" suffix=".nc" subdirs="true" /> </n:aggregation> </n:netcdf> </dataset> </catalog> It works! Other unit, other T0, 32 to 64 bit Real