Download
1 / 114
1.15k likes | 1.33k Views
Evidence-Based Medicine: Effective Use of the Medical Literature. Edward G. Hamaty Jr., D.O. FACCP, FACOI. Appraising Prognosis Articles. Appraising Prognosis Articles. Prognosis. TYPES OF REPORTS ON PROGNOSIS

E N D
Evidence-Based Medicine:Effective Use of the Medical Literature Edward G. Hamaty Jr., D.O. FACCP, FACOI
Prognosis • TYPES OF REPORTS ON PROGNOSIS • Several types of studies can provide information on the prognosis of a group of individuals with a defined problem or risk factor. The best evidence with which to answer our clinical question would come from a systematic review of prognosis studies. • A systematic review that searches for and combines all relevant prognosis studies would be particularly useful for retrieving information about relevant patient subgroups. When assessing the validity of a systematic review, we’d need to consider the guides in Table 1 . • At this time, relevant systematic reviews of prognosis studies are rare and we’ll focus the discussion in this lecture on individual studies.
Prognosis (For the prognostic factors identified)
Prognosis • Cohort studies (in which investigators follow one or more groups of individuals with the target disorder over time and monitor for occurrence of the outcome of interest) represent the best design for answering prognosis questions. Example: PPD of cigarette smokers and incidence of lung cancer, or cholesterol levels and CAD. • Randomized trials can also serve as a source of prognostic information (particularly since they usually include detailed documentation of baseline data), although trial participants may not be entirely representative of the population with a disorder. • Case–control studies (in which investigators retrospectively assess prognostic factors by determining the exposures of cases who have already suffered the outcome of interest and controls who have not) are particularly useful when the outcome is rare or the required follow-up is long. However, the strength of inference that can be drawn from these studies is limited because of the potential for selection and measurement bias.
Cohort Study • Patients who have developed a disorder are identified and their exposure to suspected causative factors is compared with that of controls who do not have the disorder. • This permits estimation of odds ratios (but not of absolute risks). • The advantages of case-control studies are that they are quick, cheap, and are the only way of studying very rare disorders or those with a long time lag between exposure and outcome. • Disadvantages include the reliance on records to determine exposure, difficulty in selecting control groups, and difficulty in eliminating confounding variables.
Randomized Controlled Trial • Similar subjects are randomly assigned to a treatment group and followed to see if they develop the outcome of interest. • RCTs are the most powerful method of eliminating (known and unknown) confounding variables and permit the most powerful statistical analysis (including subsequent meta-analysis). • However, they are expensive, sometimes ethically problematic, and may still be subject to selection and observer biases.
Case Control Study • A case-control study is an observational, retrospective study which "involves identifying patients who have the outcome of interest (cases) and control patients without the same outcome, and looking back to see if they had the exposure of interest."
Case Control Study • Patients with and without the exposure of interest are identified and followed over time to see if they develop the outcome of interest, allowing comparison of risk. • Cohort studies are cheaper and simplerthan RCTs, can be more rigorous than case-control studies in eligibility and assessment, can establish the timing and sequence of events, and are ethically safe. • However, they cannot exclude unknown confounders, blinding is difficult, and identifying a matched control group may also be difficult.
Prognosis - Validity • Is the study valid? In asking questions about a patient’s likely prognosis over time, the best individual study type to look for would be longitudinal cohort study. • 1. Is the Sample Representative? • Does the study clearly define the group of patients, and is it similar to your patients? Were there clear inclusion and exclusion criteria?
Prognosis - Validity • Were they recruited at a common point in their illness? • The methodology should include a clear description of the stage and timing of the illness being studied. To avoid missing outcomes, study patients should ideally be recruited at an early stage in the disease. In any case, they should all be recruited at a consistent stage in the disease; if not, this will bias the results. • Did the study account for other important factors? • The study groups will have different important variables such as sex, age, weight and co-morbidity which could affect their outcome. The investigators should adjust their analysis to take account of these known factors in different sub-groups of patients. You should use your clinical judgment to assess whether any important factors were left out of this analysis and whether the adjustments were appropriate. This information will also help you in deciding how this evidence applies to your patient.
Prognosis - Validity • Is the setting representative? • Patients who are referred to specialist centers often have more illnesses and are higher risk than those cared for in the community. This is sometimes called 'referral bias'. • 2 Was follow up long enough for the clinical outcome? • You have to be sure that the study followed the patients for long enough for the outcomes to manifest themselves. Longer follow up may be necessary in chronic diseases.
Prognosis - Validity • 3 Was follow up complete? • Most studies will lose some patients to follow up; the question you have to answer is whether so many were lost that the information is of no use to you. You should look carefully in the paper for an account of why patients were lost and consider whether this introduces bias into the result. • If follow up is less than 80% the study's validity is seriously undermined. • You can ask 'what if' all those patients who were lost to follow up had the outcome you were interested in, and compare this with the study to see if loss to follow up had a significant effect. With low incidence conditions, loss to follow up is more problematic.
Prognosis - Validity • We suggest considering the simple “5 and 20” rule: fewer than 5% loss probably leads to little bias, greater than 20% loss seriously threatens validity, and in-between amounts cause intermediate amounts of trouble. • While this may be easy to remember, it may over-simplify clinical situations in which the outcomes are infrequent. Alternatively, we could consider the “best” and “worst” case scenarios in an approach that we’ll call a “sensitivity analysis”.
Prognosis - Validity • Imagine a study of prognosis wherein 100 patients enter the study, 4 die and 16 are lost to follow-up. A “crude” case-fatality rate would count the 4 deaths among the 84 with full follow-up, calculated as 4/84=4.8%. • But what about the 16 who are lost? Some or all of them might have died too. In a “worst case” scenario, all would have died, giving a case-fatality rate of (4 known+16 lost)=20 out of (84 followed+16 lost) = 100, or 20/100 (i.e. 20%), which is four times the original rate that we calculated! • Note that, for the “worst case” scenario, we’ve added the lost patients to both the numerator and the denominator of the outcome rate.
Prognosis - Validity • On the other hand, in the “best case” scenario, none of the lost 16 would have died, yielding a case-fatality rate of 4 out of (84 followed+16 lost), or 4/100 (i.e. 4%). Note that, for the “best case” scenario, we’ve added the missing cases to just the denominator. • While this “best case” of 4% may not differ much from the observed 4.8%, the “worst case” of 20% does differ meaningfully, and we’d probably judge that this study’s follow-up was not sufficiently complete and threatens the validity of the study. By using this simple sensitivity analysis, we can see what effect losses to follow-up might have on study results, which can help us judge whether the follow-up was sufficient to yield valid results
Prognosis - Validity • 4 Were outcomes measured 'blind'? • How did the study investigators tell whether or not the patients actually had the outcome? The investigators should have defined the outcome/s of interest in advance and have clear criteria which they used to determine whether the outcome had occurred. Ideally, these should be objective, but often some degree of interpretation and clinical judgment will be required. • To eliminate potential bias in these situations, judgments should have been applied without knowing the patient's clinical characteristics and prognostic factors. • Outcomes are OBJECTIVE and/or BLINDED.
Prognosis - Validity • Are the results important? • What is the risk of the outcome over time? • Three ways in which outcomes might be presented are: • as a percentage of survival at a particular point in time; • as a median survival (the length of time by which 50% of study patients have had the outcome); • as a survival curve that depicts, at each point in time, the proportion (expressed as a percentage) of the original study sample who have not yet had a specified outcome. • Survival curves provide the advantage that you can see how the patient's risk might develop over time.
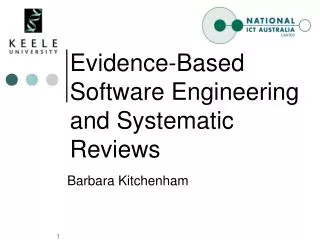
Figure Prognosis shown as survival curves (dashed line indicates median survival). A: Good prognosis (or too short of a study!). B: Poor prognosis early, then slower increase in mortality, with median survival of 3 months. C: Good prognosis early, then worsening, with median survival of 9 months. D: Steady prognosis.
Figure shows four survival curves, each leading to a different conclusion. In panel A of this figure, virtually no patients have had events by the end of the study, which could mean that either prognosis is very good for this target disorder (in which case the study is very useful to us) or the study is too short (in which case this study isn’t very helpful). In panels B, C and D, the proportion of patients surviving to 1 year (20%) is the same in all three graphs. And we could tell our patients that their chance of surviving for a year are 20%. However, the median survival (point at which half will have died—shown by the dashed line) is very different: 3 months for panel B, vs. 9 months for the disorder in panel C. The survival pattern is a steady, uniform decline only in panel D, and the median survival here is approximately 7.5 months. These examples highlight the importance of considering median survival and survival curves in order to fully inform our patient about prognosis. Median Survival 20% Median Survival 20% Median Survival 20%
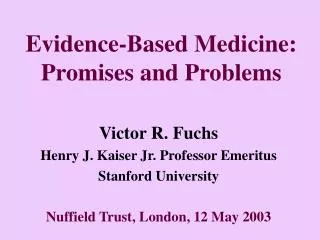
Figure 1D-1 shows two survival curves-- one of survival after a myocardial infarction and the other depicting the results of hip replacement surgery in terms of when patients needed a revision because something had gone wrong after the initial surgery. Note that the chance of dying after a myocardial infarction is highest shortly after the event (reflected by an initially steep downward slope of the curve, which then becomes flat), whereas very few hip replacements require revision until much later (this curve, by contrast, starts out flat and then steepens Revision of Hip Surgery MI
Prognosis • If subgroups with different prognoses are identified, was there adjustment for important prognostic factors and validation of these factors in an independent “test set” patients? • Prognostic factors are demographic (e.g. age, gender), disease-specific (e.g. mitral valve prolapse with mitral regurgitation), or co morbid (e.g. hypertension) variables that are associated with the outcome of interest. • Prognostic factors need not be causal—and in fact they are often not—but they must be strongly associated with the development of an outcome to predict its occurrence. For example, although mild hyponatremia does not cause death, serum sodium is an important prognostic marker in congestive heart failure (individuals with congestive heart failure and hyponatremia have higher mortality rates than heart failure patients with normal serum sodium). • Risk factors are often considered distinct from prognostic factors, and include lifestyle behaviors and environmental exposures that are associated with the development of a target disorder. For example, smokingis an important risk factor for developing lung cancer, but tumor stageis the most important prognostic factor in individuals who have lung cancer.
Prognosis - Validity • How precise are the estimates? • Any study looks at a sample of the population, so we would expect some variation between the sample and 'truth'. • Prognostic estimates should be accompanied by Confidence Intervals to represent this. You should take account of this range when extracting estimates for your patient.
Prognosis - Validity • If it is very wide, you would question whether the study had enough patients to provide useful information. • The standard error for a proportion (p) is: • SE = √{[p(1-p)]/n} • Where p is the proportion and n is the number of subjects. • Assuming a normal distribution, the 95% confidence interval is 1.96 times this value on either side of the estimate.
5 Yr Survival Rates Non SC Lung CAMeta-Analysis ± 1.96 x 5.1 = ± 9.996 or 10% [Survival = 70% SE = 5.1%] [70 ± 10 %]
Therapy Articles Is the study valid? 1 Was there a clearly defined research question? • What question has the research been designed to answer? Was the question focused in terms of the population group studied, the intervention received and the outcomes considered? 2 Were the groups randomized? • The major reason for randomization is to create two (or more) comparison groups which are similar at the start of the trial. To reduce bias as much as possible, the decision as to which treatment a patient receives should be determined by random allocation.
Therapy Articles Allocation Concealment As a supplementary point, clinicians who are entering patients into a trial may consciously or unconsciously distort the balance between groups of they know the treatments given to previous patients. For this reason, it is preferable that the randomization list be concealed from the clinicians. This is known as allocation concealment and is the most important thing to look for in appraising RCTs (Randomized Controlled Trials).
Therapy Articles • 3 Were all patients accounted for at its conclusion? • There are three major aspects to assessing the follow up of trials: • Did so many patients drop out of the trial that its results are in doubt? • Was the study long enough to allow outcomes to become manifest? • Were patients analyzed in the groups to which they were originally assigned?
Therapy Articles Drop-out rates • Undertaking a clinical trial is usually time-consuming and difficult to complete properly. If less than 80% of patients are adequately followed up then the results should be ignored. • You look at the follow-up rate reported in the study and ask yourself 'what if everyone who dropped out had a bad outcome?' Length of study • Studies must allow enough time for outcomes to become manifest. You should use your clinical judgment to decide whether this was true for the study you are appraising, and whether the length of follow up was appropriate to the outcomes you are interested in.
Therapy Articles 4 Were the research participants 'blinded'? • Ideally, patients and clinicians should not know whether they are receiving the treatment. The assessors may unconsciously bias their assessment of outcomes if they are aware of the treatment. This is known as observer bias. • So, the ideal trial would blind patients, care givers, assessors and analysts alike. The terms 'single-', 'double-' and 'triple-blind' are sometimes used to describe these permutations. However, there is some variation in their usage and you should check to see exactly who was blinded in a trial. • Of course, it may have been impossible to blind certain groups of participants, depending on the type of intervention. Researchers should endeavor to get around this, for example by blinding outcomes assessors to the patients' treatment allocation.
Therapy Articles Placebo control Patients do better if they think they are receiving a treatment than if they do not. A placebo control should be used so that patients can't tell if they're on the active treatment or not.
Therapy Articles 5 Equal treatment • It should be clear from the article that, for example, there were no co-interventions which were applied to one group but not the other and that the groups were followed similarly with similar check-ups. • Did randomization produce comparable groups at the start of the trial? The purpose of randomization is to generate two (or more) groups of patients who are similar in all important ways. The authors should allow you to check this by displaying important characteristics of the groups in tabular form.
Therapy Articles Are the results important? Two things you need to consider are how large is the treatment effect and how precise is the finding from the trial. In any clinical therapeutic study there are three explanations for the observed effect: • 1 bias; • 2 chance variation between the two groups; • 3 the effect of the treatment. Could this result have happened if there was no difference between the groups? Once bias has been excluded (by asking if the study is valid), we must consider the possibility that the results are a chance effect. Alongside the results, the paper should report a measure of the likelihood that this result could have occurred if the treatment was no better than the control.
Therapy Articles p values • The p value is a commonly used measure of this probability. Conventionally, the value of 0.05 is set as the threshold for statistical significance. If the p value is below 0.05, then the result is statistically significant; it is unlikely to have happened if there was no difference between the groups.
Therapy Articles Look to see if the confidence interval crosses the 'line of no difference' between the interventions. If so, then the result is not statistically significant. The confidence interval is better than the p value because it shows you how much uncertainty there is around the stated result.
Therapy Articles • Quantifying the risk of benefit and harm • Once chance and bias have been ruled out, we must examine the difference in event rates between the control and experimental groups to see if there is a significant difference. These event rates can be calculated as shown below.
Therapy Articles Relative risk or risk ratio (RR) • RR is the ratio of the risk in the experimental group divided by the risk in the control group. Absolute risk reduction (ARR) • ARR is the difference between the event rates in the two groups. Relative risk reduction (RRR) • Relative risk reduction is the ARR as a percentage of the control group risk
Therapy Articles ARR is a more clinically relevant measure to use than the RR or RRR. This is because relative measures 'factor out' the baseline risk, so that small differences in risk can seem significant when compared to a small baseline risk-see example below.
Therapy Articles Stroke Risk Reduction secondary to Statins. 72 7 million The benefits of ARR (NNT of 72 vs 7 Million) vs RRR (25% in both).
Therapy Articles 1. What is the magnitude of the treatment effect? • There are a variety of methods that we can use to describe results; we’ve included the most important ones in Table 5.3, and we’ll illustrate them with the help of the statin study. • As you can see from the actual trial results in Table 5.3, at a mean of 5 years’ follow-up, stroke occurred among 5.7% of patients randomized to the control group (we’ll call this the “control event rate”, CER), and in 4.3% of the patients assigned to receive statin therapy (we’ll call this the “experimental event rate”, EER). • This difference was statistically significant, but how can it be expressed in a clinically useful way? Most often we see this effect reported in clinical journals as the relative risk reduction (RRR) calculated as (|CER − EER|/CER). In this example, the RRR is (5.7% − 4.3%)/5.7% (i.e. 25%), and we can say that statin therapy decreased the risk of stroke by 25% relative to those who received placebo. • In a similar way, we can describe the situation in which the experimental treatment increases the risk of a good event as the “relative benefit increase” (RBI; also calculated as |CER − EER|/CER). Finally, if the treatment increases the probability of a bad event, we can use the same formula to generate the “relative risk increase” (RRI).
Therapy Articles • One of the disadvantages of the RRR, which makes it unhelpful for our purposes, is revealed in the hypothetical data outlined in the bottom row of Table 5.3. The RRR doesn’t reflect the risk of the event without therapy (the CER, or baseline risk), and therefore cannot discriminate huge treatment effects from small ones. For example, if the stroke risk was trivial (0.000057%) in the control group and similarly trivial (0.000043%) in the experimental group, the RRR remains 25%!
Therapy Articles • One measure that overcomes this lack of discrimination between small and large treatment effects looks at the absolute arithmetic difference between the rates in the two groups. • This is called the “absolute risk reduction” (ARR) (or the risk difference) and it preserves the baseline risk. In the statin trial, the ARR is 5.7% − 4.3%=1.4%. • In our hypothetical case where the baseline risk is trivial, the ARR is trivial too, at 0.000014%. Thus, the ARR is a more meaningful measure of treatment effects than is the RRR. • When the experimental treatment increases the probability of a good event, we can generate the “absolute benefit increase” (ABI), which is also calculated by finding the absolute arithmetic difference in event rates. Similarly, when the experimental treatment increases the probability of a bad event, we can calculate the “absolute risk increase” (ARI).
Therapy Articles Number needed to treat (NNT) • Number needed to treat is the most useful measure of benefit, as it tells you the absolute number of patients who need to be treated to prevent one bad outcome. It is the inverse of the ARR: The confidence interval of an NNT is 1/the CI of its ARR:
Therapy Articles • The inverse of the ARR (1/ARR) is a whole number and has the useful property of telling us the number of patients that we need to treat (NNT) with the experimental therapy for the duration of the trial in order to prevent one additional bad outcome. • In our example, the NNT is 1/1.4%=72, which means we would need to treat 72 people with a statin (rather than placebo) for 5 years to prevent one additional person from suffering a stroke. • In our hypothetical example, in the bottom row of Table 5.3, the clinical usefulness of the NNT is underscored, for this tiny treatment effect means that we would have to treat over 7 million patients for 5 years to prevent one additional bad event!