Download
1 / 1
10 likes | 219 Views
No. 195. Blood- based Biomarkers for Prostate Cancer. Vicki M Velonas 1 , Cris dos Remedios 1 , Henry Woo 2 , Joshua W.K. Ho 3 and Stephen Assinder 1 1 Bosch Institute, The University of Sydney, Sydney 2006 2 The Sydney Adventist Hospital, Wahroonga, 2076

E N D
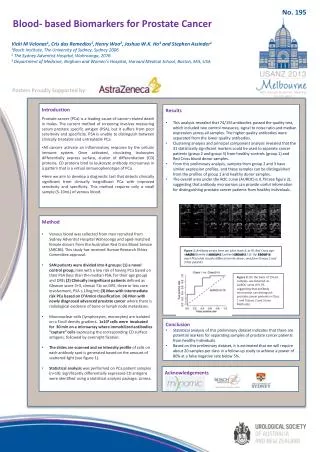
No. 195 Blood- based Biomarkers for Prostate Cancer Vicki M Velonas1, Cris dos Remedios1,Henry Woo2, Joshua W.K. Ho3 and Stephen Assinder1 1Bosch Institute, The University of Sydney, Sydney 2006 2The Sydney Adventist Hospital, Wahroonga, 2076 3Department of Medicine, Brigham and Women’s Hospital, Harvard Medical School, Boston, MA, USA Posters Proudly Supported by: • Introduction • Prostate cancer (PCa) is a leading cause of cancer-related death in males. The current method of screening involves measuring serum prostate specific antigen (PSA), but it suffers from poor sensitivity and specificity. PSA is unable to distinguish between clinically treatable and untreatable PCa. • All cancers activate an inflammatory response by the cellular immune system. Once activated, circulating leukocytes differentially express surface, cluster of differentiation (CD) proteins. CD proteins bind to leukocyte antibody microarrays in a pattern that is a virtual immunophenotype of PCa. • Here we aim to develop a diagnostic test that detects clinically significant from clinically insignificant PCa with improved sensitivity and specificity. This method requires only a small sample (5-10mL) of venous blood. • Results • This analysis revealed that 74/155 antibodies passed the quality test, which included two control measures, signal to noise ratio and median expression across all samples. The higher quality antibodies were separated from the lower quality antibodies. • Clustering analysis and principal component analysis revealed that the 31 statistically significant markers could be used to separate cancer patients (group 2 and group 3) from healthy controls (group 1) and Red Cross blood donor samples. • From this preliminary analysis, samples from group 2 and 3 have similar expression profiles, and these samples can be distinguished from the profiles of group 1 and healthy donor samples. • The overall area under the ROC curve (AUROC) is 0.79 (see figure 2), suggesting that antibody microarrays can provide useful information for distinguishing prostate cancer patients from healthy individuals. ARCBS GROUP 1 GROUP 2 GROUP 3 • Method • Venous blood was collected from men recruited from Sydney Adventist Hospital Wahroonga and aged-matched female donors from the Australian Red Cross Blood Service (ARCBS). This study has received Human Research Ethics Committee approval. • SAN patients were divided into 4 groups: (1) a novel control group; men with a low risk of having PCa based on their PSA (less than the median PSA, for their age group) and DRE; (2) Clinically insignificant patients defined as Gleason score 3+3, clinical T1c on DRE, three or less core involvement, PSA ≤ 10ng/ml; (3) Men with intermediate risk PCa based on D’Amico classification. (4) Men with newly diagnosed advanced prostate cancer where there is radiological evidence of bone or lymph node metastases. • Mononuclear cells (lymphocytes, monocytes) are isolated on a Ficoll density gradient.. 1x10⁶cells were incubated for 30 min on a microarray where immobilized antibodies “capture” cells expressing the corresponding CD surface antigens, followed by overnight fixation. • The slides are scanned and an intensity profile of cells on each antibody spot is generated based on the amount of scattered light (see figure 1). • Statistical analysis was performed on PCa patient samples (n=19). Significantly differentially expressed CD antigens were identified using a statistical analysis package, Limma. Figure 1: Antibody arrays from our pilot study (L to R): Red Cross age-matched female donor, and 3 patients (Groups 1-3). Gp 1 (mild, no overt PCa) slide visually differs from the donor, and from Groups 2 and 3 PCa patients. Figure 2:On the basis of 19 test samples, we obtained an AUROC value of 0.79, suggesting that antibody microarrays can distinguish prostate cancer patients in Class 1 and Classes 2 and 3 (see Methods). • Conclusion • Statistical analysis of this preliminary dataset indicates that there are potential markers for separating samples of prostate cancer patients from healthy individuals. • Based on this preliminary dataset, it is estimated that we will require about 20 samples per class in a follow-up study to achieve a power of 80% at a false negative rate below 5%. Acknowledgements