Download
1 / 16
160 likes | 253 Views
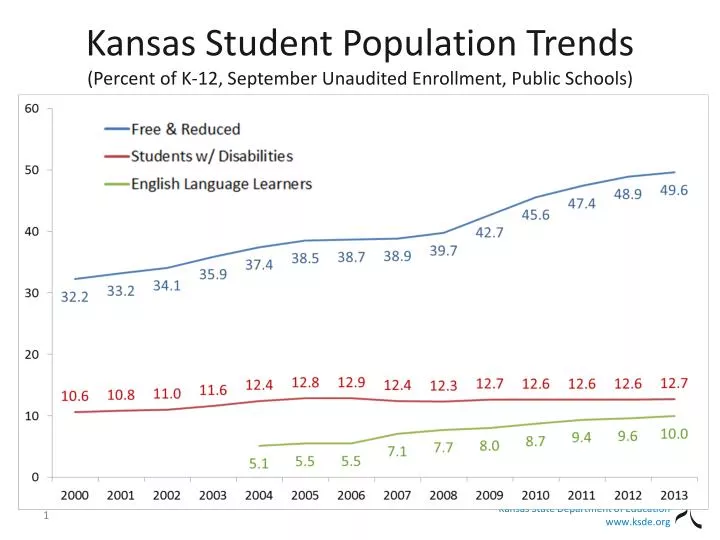
Kansas Student Population Trends (Percent of K-12, September Unaudited Enrollment, Public Schools). Reading Gap by Percent Proficient, SES levels, 2000 – 2013, (report c ard population).

E N D
Kansas Student Population Trends(Percent of K-12, September Unaudited Enrollment, Public Schools)
Reading Gap by Percent Proficient, SES levels, 2000 – 2013, (report card population)
Reading Gaps by Percent Proficient & Ethnicity: 2000 – 2013(percent proficient, all grades, report card population)
Math Gap by Percent Proficient, SES levels,2000 – 2013, (report card population)
Math Gap by Percent Proficient & Ethnicity, 2000 – 2012(report card population)
Reading Gap Measured by the API, 2000 – 2013, (all grades, report card population)
Reducing the Percent Non-Proficient, Reading, Free & Reduced Trends, (report card population)
Trends, Reducing the Percent Non-Proficient, by Ethnicity,(report card population)
Reducing the Percent Non-Proficient, ELL & Students w/ Disabilities Trends, (report card population) 9
State Subgroup Performance in Reducing the Percent Non-Proficient in Reading:
Math Gap Measured by the API, 2000 – 2013, All Grades, Report Card Pop.
Math Gap by Reducing Non-Proficient, Free & Reduced combined, 2000 – 2013, (report card pop.)
Trends, Reducing the Percent Non-Proficient by Ethnicity,(report card population)
State Subgroup Performance in Reducing the Percent Non-Proficient in Math:
Graduation Rate 4-yr. adjusted cohort graduation formula