Download
1 / 34
340 likes | 413 Views
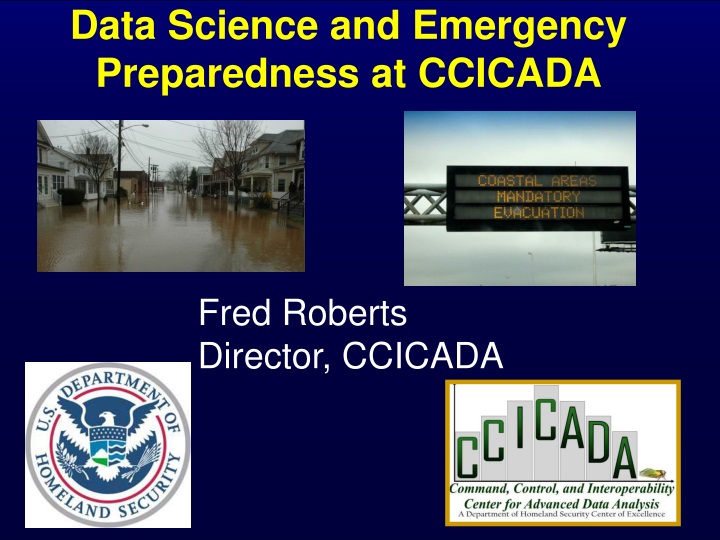
Data Science and Emergency Preparedness at CCICADA. Fred Roberts Director, CCICADA. DHS CVADA Center. CCICADA = Command, Control & Interoperability Center for Advanced Data Analysis

E N D
Data Science and Emergency Preparedness at CCICADA Fred Roberts Director, CCICADA
DHS CVADA Center • CCICADA = Command, Control & Interoperability Center for Advanced Data Analysis • One of two coordinated “halves” of the Center for Visual and Data Analytics, founded by DHS as a university center of excellence in 2009. • CCICADA is based at Rutgers • CCICADA emphasizes data analysis. • The other half of the CVADA Center is based at Purdue and emphasizes visual analytics. 2
CCICADA Partners Alcatel-Lucent Bell Labs AT&T Labs - Research City College of NY Howard University Princeton University Rensselaer Polytechnic Inst. Texas Southern University University of Massachusetts, Lowell University of Medicine & Dentistry of NJ Applied Communications Sciences Carnegie-Mellon Univ. Geosemble Technologies Morgan State University Regal Decision Systems Rutgers University (Lead) Tuskegee University University of Illinois, Urbana Champaign University of Southern California
Why CCICADA? Virtually all of the activities in the homeland security enterprise require the ability to reach conclusions from massive flows of data. This is especially true in emergency preparedness. Here: Examples of CCICADA projects involving data science and emergency preparedness 4
Example 1. Project with FEMA Region II: Flood Mitigation on the Raritan River in NJ Developed data-driven methods to determine which flood mitigation projects to invest in Buyouts Better flood warning systems “Green infrastructure” (cisterns & rain barrels) Pervious concrete Etc. Raritan River flood Bound Brook, NJ August 2011
Flood Mitigation on the Raritan River New tools for Data-driven Decision Support Data driven. Assemble data about: Precipitation (duration, amount) Antecedent conditions (soil moisture content, ground cover, seasonality) River guage levels Flood maps Property damage data – FEMA payouts
Flood Mitigation on the Raritan River Developed general model for flood mitigation investment decision making Component 1: Hydrological model to measure impact on peak flow of different mitigation strategies (catch basins, cisterns, “green infrastructure,” flood buyouts, better flood warning systems) Component 2: Nonlinear, threshold-based regression modelto relate peak flow and aggregrate flow over flood level to property damage (insurance claims) Combined 2 components to calculate savings due to different flood mitigation strategies Conclusion: linking of meteorology, hydrology, non-linear econometric modeling provides powerful tool for flood mitigation decision making 7
Flood Mitigation on the Raritan River Project Participants: Blake Cignarella, Carlos Correa, QuizhongGuo, Paul Kantor, Fred Roberts, David Robinson – all Rutgers 8
Example 2: Hippocrates Health Emergency Situational Awareness System • NJ’s response to anthrax scare of 2001 developed into Hippocrates, a web-based situational awareness • tool developed by NJ Dept. of • Health and Senior Services • Utilized by federal and state • agency partners. 9
Hippocrates Health Emergency Situational Awareness System • Applicability of Hippocrates to first responders limited due to difficulties of using it in the field. • NJ DHSS asked CCICADA to develop smart phone applications to enhance usability of Hippocrates by first responders. 10
Hippocrates Health Emergency Situational Awareness System • Apps developed for iPhone and Android • Certified software tester • Worked with first responders • Prototype delivered to NJ DHSS • They take over development Project Participants: UMDNJ: PanosGeorgopolous, SastryIsukapalli, Paul Lioy Rutgers: MuthuMuthukrishnan, Christie Nelson, Bill Pottenger, Fred Roberts, Yves Sukhu 11
Example 3: Social Media and Emergency Response • People are everywhere; observe environments • Interconnected and reporting, they are an intelligent distributed ‘sensor’ network • We can track information flow on the non-private part of the network to determine what’s going on. • Catastrophes: Situation monitoring and response planning • Anomaly Detection: Recognizing problems before they occur • Challenge: Can we find out when events occur and how they develop by watching the twitter stream?
Social Media and Emergency Response Project Participants UIUC: Dan Roth USC: Ed Hovy RPI: Cindy Hui, Al Wallace Rutgers: Paul Kantor, MorNamman, Bill Pottenger, RannieTeodoro How do people use social media in emergency situation? Funded by DHS First Responder Group Collaboration among Rutgers, RPI, USC/ISI Campus experiments at Rutgers (“Hat Chase”), data from real emergency near RPI Collaboration with NJ OHSP and CUPSA (Assn of Campus Police of NJ)
Social Media and Emergency Response Our work in these projects has found: Great diversity of communication Interesting characteristics of network spread People coordinate in different ways People follow typical sequences when communicating in emergency situations Understanding typical sequence allows crisis responders and others to identify “relapses,” pick out anomalies, etc. New work usingover 1 billion tweets from twitter, and communications during Japanese earthquake and tsunami and Haitian earthquake. Looking for algorithmic approaches to processing large amounts of social media data 14
Trustworthiness in Disaster Situations • Data during emergencies is often inconsistent or conflicting • Could be due to noise or malicious intent • Developing computational tools to address problem of trustworthiness in such contexts • Need find appropriate degree of “trust” in claims made. • Need precise definitions of and metrics for factors contributing to trust: accuracy, completeness, bias Project Participants UIUC: Dan Roth USC: Ed Hovy RPI: Cindy Hui, Al Wallace Rutgers: Paul Kantor, MorNamman, Bill Pottenger, RannieTeodoro
Example 4: Port Resilience 16 • Ports might be shut down by terrorist attacks, natural disasters like hurricanes or ice storms, strikes or other domestic disputes, etc. • Project themes: • How do we design port operations to minimize vulnerability to shut down? • How do we reschedule port operations in case of a shutdown?
Reopening a Port After Shutdown 17 Shutting down ports is not unusual – e.g., hurricanes Scheduling and prioritizing in reopening the port is often done very informally Improving on existing decision support tools for port reopening could allow us to take many more considerations into effect Can modern algorithmic methods based in data science help here?
Manifest Data 18 • Part of the solution to the port reopening problem: Detailed information about incoming cargo: • What is it? • What is its final destination? • What is the economic impact of delayed delivery? • A key is to use container manifest datato estimate economic impact of various disaster scenarios & understand our port reopening requirements
Visualization Tools Applied to Manifest Data Visualizing data can give us insight into interconnections, patterns, and what is “normal” or “abnormal.” Visualization is part of another effort, but similar methods can help with the port reopening problem Our visual analysis methods are based on tools originally developed at AT&T for detection of anomalies in telephone calling patterns – e.g., quick detection that someone has stolen your AT&T calling card. The visualizations are interactive so you can “zoom” in on areas of interest, get different ways to present the data, etc. 19
Manifest Data 21 • Aside: Use of manifest data to do risk scoring of containers • We obtained from CBP one year’s data consisting of manifests for all cargo shipments to all US ports from container ships – every Wed. • Goal: Identify mislabeled or anomalous shipments through scrutiny of manifest data • Goal: compare effect of Japanese tsunami 21
Manifest Data • Test of our risk scoring methods: looked at manifest data from before and after the Japanese tsunami. Expected to find differences. Credit: National Geographic News 22
Manifest Data • We used statistical analysis tools (Poisson regression) to detect patterns or time trends of important variables. • Found that pattern of frequency data based on “domestic port of unlading” is statistically different before and after the tsunami. • But the pattern based on distribution of carrier is not • Conclusion: Don’t depend on just one variable to uncover anomalies. 23
Resilience Modeling 24 • If a port is damaged or closed, immediate problem of rerouting some or all incoming vessel traffic – if the reopening will be delayed for awhile. • Also: problem of prioritizing the reopening of the port – and deciding whether and how to reorder ships’arrivals/unloading • These problems can be subtle. • Ice storm shuts down port • Maybe priority is unload salt to de-ice. It wasn’t a priority before.
Resilience Modeling 25 • Problem: Reschedule unloading of queued vessels. • Done by consult with shippers and their priorities • Also consult with key government agencies to target priority goods or shipments • Take into account potential spoilage of cargo • Take into account acute shortage of key items: food, fuel, medicine, etc. • Thus: Many variables to take into account and juggle
Resilience Modeling 26 There are some subtleties: • The manifest data is unclear. In the case of water, 150 could mean 150 bottles of water or 150 cases of bottles of water. • The manifest data is unclear: Descriptions like “household goods” are too vague to be helpful • Different goods have different priorities. Forexample, not having enough food, fuel or medicine is much more critical than not having enough bottles of water.
Resilience Modeling: Formulation 27 Desired amounts of each good Priorities for each good Port capacity: number of ships per timeslot Desired arrival time for each good Penalties for late arrival of a good Unloading time per ship. Delay time before unloading can begin – per ship Storage time for unloaded goods We made simplifying assumptions for each of these and formulated an optimization problem precisely. Our methods show that sometimes a “greedy algorithm” can solve this problem. Other times, the problem is NP-complete, i.e., “computationally intractable” Project Participants: James Abello, TsvetanAsamov, Endre Boros, Mikey Chen, Paul Kantor, Neil Parikh, Fred Roberts, EmreYamangil– all Rutgers
Example 5: Evacuation Modeling One of effects of climate change is increasing number of extreme heat events. Of great concern to CDC modeling group. Our work has emphasized evacuations during extreme heat events. Work is relevant to floods, hurricanes, etc. Modeling challenges: Where to locate the evacuation centers? Whom to send where? Goals include minimizing travel time, keeping facilities to their maximum capacity; sending people to facilities that can deal with their special needs 28
Optimal Locations for Shelters in Extreme Heat Events • Work based in Newark NJ • Data includes locations of potential shelters, travel distance from each city block to potential shelters, and population size and demographic distribution on each city block. • Determined “at risk” age groups and their likely levels of healthcare needed to avoid serious problems 29
Optimal Locations for Shelters in Extreme Heat Events • Computed optimal routing plans for at-risk population to minimize adverse health outcomes and travel time • Used techniques of probabilistic mixed integer programming and aspects of location theory constrained by shelter capacity (based on predictions of duration, onset time, and severity of heat events) Project participants: EndreBoros, MelikeGursoy, Nina Fefferman – all Rutgers 30
Example 6: Economics and Security • A joint project of 3 DHS COEs: CCICADA, CREATE, NTSCOE called the Urban Commerce and Security Study (UCASS) • The challenge: Understand the interface between security and commerce; what are the economic impacts of security initiatives. • Problem initiated around the WTC site in Lower Manhattan. 31
UCASS • Ultimate Project Goal: Develop a decision support toolthat planners and decision makers can use to make choices about security initiatives/countermeasures • Usable to compare security measures or packages (“portfolios”) of security measures as to risk and economic consequences • Seek insights into when security acts as a barrier to economic activity and when it enhances such activity
UCASS Research Methodology • Developed Modeling/Simulation Tools: • ARENA and OMNet++ • Input: scenario and a security countermeasure • Input: information about probabilities of different movements/behaviors • If a pedestrian passes a restaurant, what is probability she will go inside? • If a car finds a street blocked, what is probability it will make a right turn and seek a parallel street? • Output: Changes in level of economic activity (after an hour, day, year) • Combine with CREATE economic models to estimate spillover effects/ regional economic impact 33
Other Applications • Worked with partners such as NJ OHSP to explore applications ofthe methodology. • NYC OEM suggested applying methods to recovery from disasters: which facility to reopen first? Project participants: San Jose State: Brian Jenkins USC: MisakAvetisyan, Sam Chatterjee, Steve Hora, Adam Rose, Heather Rosoff Rutgers: Selim Bora, Renee Graphia, Cindy Hui, Paul Kantor, Chistie Nelson, Bill Pottenger, Fred Roberts, Andrew Rodriguez, Jim Wojtowicz 34