Download
1 / 43
430 likes | 580 Views
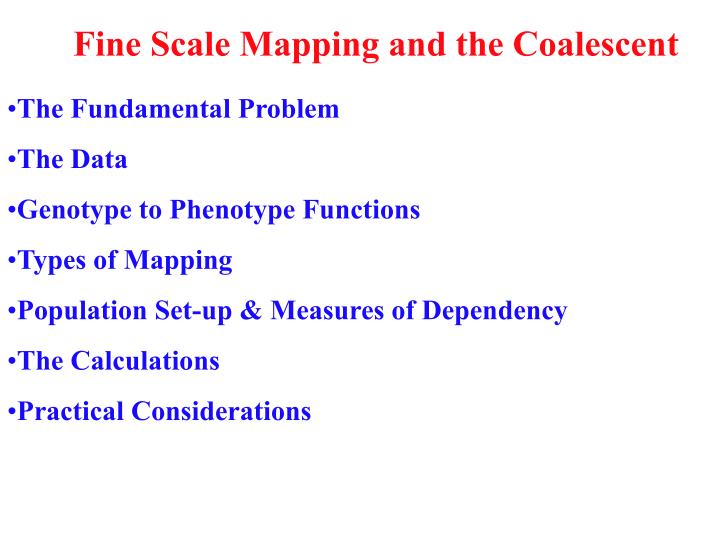
Fine Scale Mapping and the Coalescent. The Fundamental Problem The Data Genotype to Phenotype Functions Types of Mapping Population Set-up & Measures of Dependency The Calculations Practical Considerations. Genotype and Phenotype Covariation: Gene Mapping. Decay of local dependency. Time.

E N D
Fine Scale Mapping and the Coalescent • The Fundamental Problem • The Data • Genotype to Phenotype Functions • Types of Mapping • Population Set-up & Measures of Dependency • The Calculations • Practical Considerations
Genotype and Phenotype Covariation: Gene Mapping Decay of local dependency Time Reich et al. (2001) Genetype -->Phenotype Function Dominant/Recessive. Penetrance Spurious Occurrence Heterogeneity genotype phenotype Genotype Phenotype Sampling Genotypes and Phenotypes Result:The Mapping Function A set of characters. Binary decision (0,1). Quantitative Character.
D r r M D M Pedigree Analysis & Association Mapping Association Mapping: Pedigree Analysis: 2N generations Pedigree known Few meiosis (max 100s) Resolution: cMorgans (Mbases) Pedigree unknown Many meiosis (>104) Resolution: 10-5 Morgans (Kbases) Adapted from McVean and others
Causes of linkage disequilibrium D M D M Time t ago Now Creates LD Breaks down LD Drift Recombination Selection Gene conversion Admixture
Significance of a Single Association Disease locus Marker locus Disease locus Marker locus Test for independence in 2 times 2 Contingency Table
Measuring Linkage Disequilibrium between 2 Loci with 2 Alleles Remade from McVean DA,B =fA,B-fAfB =-Da,B =-DA,b =Da,b Correlation Coeffecient Measure [0,1] Hill & Robertson (1968) Range constrained by allele frequencies [0,1] Lewontin (1964) Odds-ratio formulation Devlin & Risch (1995)
Disease locus Marker loci Examples of Associations: Pairwise, Triple,... Combine Single (Pairwise) to Multiple Tests Bonferroni Sharper bounds using linkage information.
ApoE and Alzheimers Syndrome Causative SNP 6 markers with low association Martin et al 2000
The coalescent with recombination or gene conversion Adapted from Hudson 1990 Recombination: Gene Conversion:
Local trees for recombination and gene conversion Gene conversion Recombination 1 2 3 4 1 2 4 3 1 2 3 4 1 2 4 3 1 2 3 4 1 2 3 4 Tree 1 Tree 2 Tree 3 Tree 1 Tree 2 Tree 1
Measures of tree similarity Target tree Target Region with no recombination Same tree as target Same topology as target Same MRCA as target 1 2 3 4 5 Same tree Same topology Same MRCA 1 2 3 4 5 1 2 3 4 5 1 2 3 4 5
Local trees of the target and other positions Sample size = 20 Only recombination, r=2. Also gene conversion g/r=4 From Mikkel Schierup
Probability that the largest segment does not include the target From Mikkel Schierup
Target A B Quantifying the mosaicism caused by Gene Conversion A and B are the most distant markers in significant LD with target What is the proportion of markers between these also in significant LD? From Mikkel Schierup
Development of multi-locus association methods • Single Marker Methods • Kaplan et al.(1995), Rannala & Slatkin (1998) • Problem: Difficult to combine markers. • Haplotype methods with star-shaped genealogies • Terwilliger (1995), Graham & Thompson (1998),McPeek & Strahs(1999), Morris et al.(2000) • Problem: wrong genealogy, gives overconfidence in result. • Haplotype methods based on the coalescent • Rannala & Reeve (2001), Morris et al.(2002), Larribe et al. (2003). • Problem: computationally intensive Based on Morris et al. 2002
Probability of Data I: 3 step approach: I Probability of Data given topology and branch lengths Felsenstein81 for each column Multiply for all columns GCAGGTT TCAGCCT TCAGCAT II Integrate over branch lengths III Sum over topologies Conclusion: Exact Calculation Computationally Intractible!!
Probability of Data II: Griffiths & Tavavé TPB46.2.131-149 q(n’’) –determined by equilibrium distribution. ACCTAGGAT TCCTAGGAT (1,2) coalescence 3*9*3 mutations ACCTAGGAT TCCTAGGAT TCCTAGGAT n=
n=(3,1,2) n=(2,1,2) n=(3,1,2) 1 1 1 2 2 3 3 1 2 3 2 Griffiths-Ethier-Tavare Recursions Griffiths-Marjoram (1996) included recombination in the equations.
Example: Solving Linear System ?? q( ) r(,) r(,) r(,) r(,) ?? ?? r(,) r(,) r(,) r(,) q( ) r(,) q( ) ??
Example: Solving Linear System Construct Markov transition function, A(x,y), with following properties: i) A(x,y) > 0 when r(x,y) >0 ii) The chain visits A with certainty. • Introduced in coalescence theory by Griffiths & Tavare (1994) • Griffiths & Marjoram (1996) included recombination • Donnelly-Stephens-Fearnhead (2000-) accelerated these algorithms
The position of the marker locus is missing data Larribe and Lessard.(2002) Data: haplotype phenotype multiplicity 15 3 6 2 1 2 1 Where is the disease causing disease? Likelihood as function of disease locus position
Bayesian approach to LD mapping Continuous version of Bayes formula f (parameters)= prior distribution of parameters P(data|parameters)= L(parameters)= likelihood function f (P|D) = posterior distribution of parameters given data The evolutionary parameter (e.g. disease location) is considered to have prior distribution (any prior knowledge we may have) and we learn about parameters through data Advantage: f (parameters|data)is the full distribution of parameters of interest given data, e.g. confidence intervals
The basic equation Marginal posterior distribution of disease position:
Parameters in Shattered Coalescent Model Morris, Whittaker and Balding (2001,,2003,2004.. P(x,h,W,T,z,N,r|A,U) ~ L(A,U|x,h,W,T,z,N) p(W,T,z|r) p(r) p(r) = 2r, p(W,T,z|r) prior distribution of genealogies (coalescent like) xLocation of disease locus h Population marker-haplotype proportions Wbranch lengths of genealogical tree T topology (branching pattern) ZParental-status Neffective population size rshattering parameter A, Ucases, controls Probability of Haplotypes associated Mutant At recombination markers are incorporated from the population distribution.
Morris et al: The Shattered Coalescent Advantages: Allows for multiple origins of the disease mutant + sporadic occurrences of the disease without the mutation Coalescent tree Morris, Whittaker & Balding,2002
Monte-Carlo (Metropolis) sampling and integration Metropolis et al.(1953) • Evaluate the function in the current point p, f(p)=x • Suggest a new point, p' • Evaluate the function in this point f(p') = y • If x < y, go to point p' • If x > y, go to point p' with the probability y/x Due to Jesper Nymann
Monte-Carlo (Metropolis) 2? 2? Projection on one axis equivalent to integration over the remaining parameters 1 2! 1 2 3 1 Due to Jesper Nymann
Example 1 - Cystic fibrosis 11 19 Morris et al.(2002). Due to Jesper Nymann
Example 2 - BRCA2 Iceland Genomics Corporation: 1132 Cases, 54 with known mutation 758 Controls Due to Jesper Nymann
Example 2 - BRCA2 continued True Location 1 3 5 7 9 11 13 15 1 3 5 7 9 11 13 15 Multipoint calculation for the full BRCA2 dataset Multipoint calculation where the 54 known mutation cases has been removed. Due to Jesper Nymann
The Basic Setup Simulation Parameters: Recombination rate = 50 Number of leaf nodes = 1000 Number of markers = 10 Diseased haplotype fraction: 0.08 – 0.12 No Heterogeneity Simulated under the asumption of constant population size Diplotypes (phase known) Type of simulation 50% quantile Basic (red curve) 0.044 Due to Jesper Nymann
The effect of marker density Type of simulation 50% quantile 19 markers (blue curve) 0.0292 19 markers and recombination rate = 100 (yellow curve) 0.02321 Basic (red curve) 0.044 Due to Jesper Nymann
The effect of knowing phase Due to Jesper Nymann
The Effect of knowing gene genealogy Type of simulation 50% quantile With known genealogy (blue curve)0.03516 Basic (red curve) 0.044 Due to Jesper Nymann
The effect of disease fraction Type of simulation 50% quantile Disease fraction 12% - 14% (blue curve) 0.0353 Disease fraction 18% - 22% (yellow curve) 0.03229 Basic (red curve) 0.044 Due to Jesper Nymann
The effect of Heterogeneity Type of simulation 50% quantile With Heterogeneity (blue curve) 0.065587 Basic (red curve) 0.044 Due to Jesper Nymann
The effect of Impurity of cases and controls Cases Controls 33% cases are moved to the controls and a similar number of controls are moved to the cases Type of simulation 50% quantile With mixed cases/controls (blue curve) 0.1518 Basic (red curve) 0.044 Due to Jesper Nymann
LD in background population Gene Pool Type of simulation 50% quantile LD in background (blue curve) 0.0419 Basic (red curve) 0.044 Due to Jesper Nymann
Comparing the different scenarios Due to Jesper Nymann
Summary The Fundamental Problem The Data Genotype to Phenotype Functions Types of Mapping Population Set-up & Measures of Dependency Methods: Pure Coalescent Based The Shattered Coalescent Factors influencing mapping error.
Articles I M. A. Beaumont and B. Rannala (2004) The Bayesian Revolution in genetics, Nature Reviews, Genetics vol. 5. 251 Botstein D, Risch N. (2003) Discovering genotypes underlying human phenotypes: past successes for mendelian disease, future approaches for complex disease. Nat Genet. 33 Suppl:228-237. Cardon, L. and J. Bell (2001) “Association Study Designs for Complex Diseases “ Nature Review Genetics Daly, M. J., Rioux, J. D., Schaner, S. F., Hudson, T. J. & Lander, E. S. (2001), High-resolution haplotype structure in the human genome, Nat Genet 29(2), 229-232. Devlin, B. & Roeder, K. (1999), Genomic control for association studies, Biometrics 55(4), 997-1004. Frisse, L et al.(2001) Gene Conversion and Different Population Histories May Explain the Contrast between Polymorphisms and LD Levels. AJHG 69..?-? Gabriel, S. B. et al. (2002), The structure of haplotype blocks in the human genome, Science 296(5576), 2225-2229. Griffiths,R & S. Tavare (1994) “ Simiulating probability distributions in the coalescent ” Theor.Pop.Biol. 46.2.131-159 Griifiths, R. and P. Marjoram (1996) “Ancestral inference from samples of DNA sequences with recombination ”J.Compu.Biol. Hudson, R. R. (1990).Gene genealogies and the coalescent process, “Oxford Surveys in Evolutionary Biology” (D. futuyma and J. Antonovics, Eds.) Vol 7, pp. 1-44, Oxford Univ. Press, Oxford, UK B. Kerem, J. M. Rommens, J. A. Buchanan D. Markiewicz, T. K. Cox, A. Chakravarti, M. Buchwald and L. C. Tsui Identification of the Cystic Fibrosis Gene: Genetic Analysis Science 245: 1073-1080, 1989 Kong A, et al. (2002) A high-resolution recombination map of the human genome. Nat Genet. 31,241-7. Laitinen et al. (2004) Characterization of a common susceptibility locus for Asthma-related traits. Nature 304, 300-304. Martin, E. R., et al. (2000), SNPing away at complex diseases: analysis of single-nucleotide polymorphisms around APOE in Alzheimer disease, Am J Hum Genet 67, 383-394. Larribe, M, S. Lessard and Schork (2002) “Gene Mapping via the Ancestral Recombination Graph”. Theor. Pop.Biol. 62.215-229. Liu,J. et al.(2000) “Bayesian Analysis of Haplotypes for Linkage Disequilibrium Mapping” Genome Research 11.1716-24. Martin, E. et al.(2001) “SNPing Away at Complex Diseases: Analysis of Single-Nucleotide Polymorphisms around APOE Alzheimer Disease” AJHG 67.838-394. N Metropolis N AW Rosenbluth, MN Rosenbluth, AH Teller, E Teller (1953) Equation of state calculation by fast computer machines,J. Chem. Phys. 21:1087-1092 McVean,G.(2002) “A Genealogical Interpretation of Linkage Disequilibrium” Genetics 162.987-991 Morris, A., JC Whittaker and D. Balding “Fine-Scale Mapping of Disease Loci via Shattered Coalescent Modeling of Genealogies” AJHG 70.686-707. Morris, J. C. Whittaker, and D. J. Balding (2004) Little loss of information due to unknown phase for fine-scale LD mapping with SNP genotype data,AJHG . 74: 945-953, 2004 Andrew P. Morris, John C. Whittaker, Chun-Fang Xu, Louise K. Hosking, and David J. Balding Multipoint linkage-disequilibrium mapping narrows location interval and identifies mutation heterogeneity, PNAS November 11, 2003, Vol. 100, 13442-13446
Articles II McVean GA, Myers SR, Hunt S, Deloukas P, Bentley DR, Donnelly P. (2004) The fine-scale structure of recombination rate variation in the human genome. Science 304:581-584. Patil, N. et al. (2001) Blocks of limited haplotype diversity revealed by high-resolution scanning of human chromosome 21. Science 294: 1719-1723. Reich, D. E. et al. (2001), Linkage disequilibrium in the human genome, Nature 411(6834), 199-204. Reich D. E. and Lander, E. On the allelic spectrum of human diseases. Trends in Genetics 19, 502-510. Reich, D. E. et al. (2002), Human genome sequence variation and the influence of gene history, mutation and recombination, Nat Genet 32(1), 135-142. Risch, N. and Merikangas, K. (1996) The future of genetic studies of complex human diseases. Science 273, 15161-1517. Pritchard, J. K., Stephens, M., Rosenberg, N. A. & Donnelly, P. (2000), Association mapping in structured populations, Am J Hum Genet 67(1), 170-181. Stefansson, H. et al. (2003), Association of neuregulin 1 with schizophrenia confirmed in a Scottish population, Am J Hum Genet 72(1), 83-87. Stephens JC et al. (2001) Haplotype variation and linkage disequilibrium in 313 human genes. Science.;293(5529):489-93. Strachan, T. & Read, A. P. (2003) Human Molecular Genetics 3, BIOS Scientific Publishers Ltd, Wiley, New York. Spielman R S and W J Ewens (1996) The TDT and other family-basedtests for linkage disquilibrium and association. Am. J. Hum. Gen. 59:983-989 The International HapMap Consortium (2003) The International HapMap Project. Nature 426, 789-795. Weiss, KM and Clark, AG (2002) Linkage disequilibrium and the mapping of complex human traits. Trends in Genetics 18:19-24. Pritchard, J and M. Przeworski (2000) Linkage Disequilibrium in Humans: Models and Data AJHG 69.1-14. Pritchard, JK et al.(2000) “Association Mapping in Structured Populations” Am.J.Hum.Genet. 67.170-181 . Pritchard and Cox (2002) “The allelic architecture of human disease genes: common disease-common variant … or not” Human Molecular Genetics 11.20.2417-2Rannala, B and JP Reeve (2001) High-Resolution Multipoint Linkage-Disequilibrium Mapping in the Context of a Human Genome Sequence AMJHG 69.159-178. R S Spielman and W J Ewens (1996) The TDT and other family-basedtests for linkage disquilibrium and association. Am. J. Hum. Gen. 59:983-989 Tabor, Risch and Myers (2002) Candidate-gene approaches for studying complex genetic traits: practical considerations Nature Reviews Genetics 3.May.1-7 Terwilliger,JD et al(2002) A bias-ed assessement of the use of SNPs in human complex traits. Curr.Opin. Genetics & Development 12.726-34 Weiss,K and Terwilliger, J (2000) “How many diseases does it take to map a disease with SNPs” Nature Genetics vol. 26 Oct.
Books & Www-sites Books Encyclopedia of the Human Genome (2003) Nature Publishing Group Liu, . J(2001) “Monte Carlo Strategies in Scientific Computation” Springer Verlag Ott, J.(1999) Analysis of Human Genetic Linkage 3rd edition Publisher: John Hopkins Strachan & Read (2004) Human Molecular Genetics III Publisher: Biosciences Weiss,K.(1993) “Genetic Variation and Human Disease” Cambridge University Press. Web-sites www.stats.ox.ac.uk/mcvean Jeff Reeve and Bruce Rannala A multipoint linkage disequilibrium disease mapping program (DMLE+) that allows genotype data to be used directly and allows estimation of allele ages. http://dmle.org/ Liu, J.S., Sabatti, C., Teng, J., Keats, B.J.B. and N. Risch (Version upgraded by Xin Lu, June/9/2002) This is the software for the Bayesian haplotype analysis method developed by Liu, J.S., Sabatti, C., Teng, J., Keats, B.J.B. and N. Risch in article Bayesian Analysis of Haplogypes for Linkage Disequilibrium Mapping. Genome Research 11:1716, 2001 http://www.people.fas.harvard.edu/~junliu/TechRept/03folder/bladev2.tar J. N. Madsen, M.H. Schierup, C. Storm, and L. Schauser, T. MailundCoaSim is a tool for simulating the coalescent process with recombination and geneconversion under the assumption of exponential population growth http://www.birc.dk/Software/CoaSim/