Download
1 / 15
150 likes | 264 Views
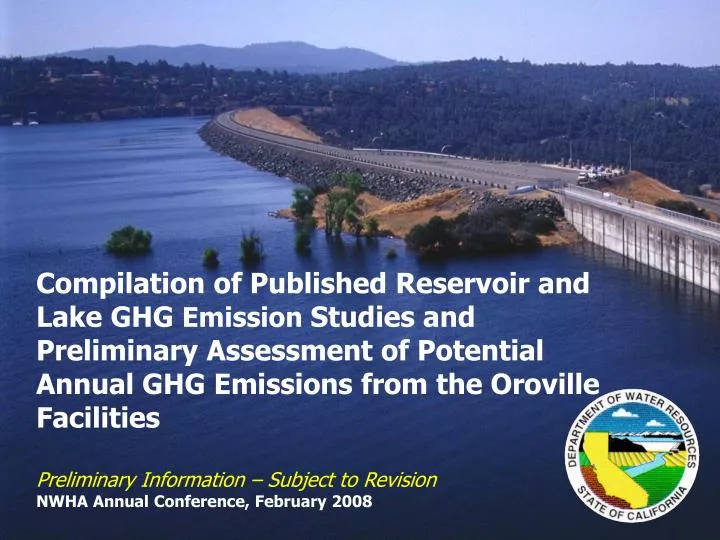
Compilation of Published Reservoir and Lake GHG Emission Studies and Preliminary Assessment of Potential Annual GHG Emissions from the Oroville Facilities Preliminary Information – Subject to Revision NWHA Annual Conference, February 2008. The SWP and Oroville Facilities.

E N D
Compilation of Published Reservoir and Lake GHG Emission Studies and Preliminary Assessment of Potential Annual GHG Emissions from the Oroville FacilitiesPreliminary Information – Subject to RevisionNWHA Annual Conference, February 2008
Compilation of Relevant Information • Reports by Tremblay et al. (2005 and 2006) • Most comprehensive work on lake and reservoir gross GHG emissions • Soumis et al (2004) study at the Lake Oroville • Only empirical data collected at Lake Oroville or other 5 Western U.S. reservoirs • Data is limited - only collected during September 2001 • Other relevant sources of information • IPCC, USEPA, USDOE, EIA, NOAA, IRN, and others cited
Why be Concerned with Reservoir GHG Emissions? • Assembly Bill 32, CA Global Warming Solutions Act of 2006 mandates CARB adopt statewide GHG reporting regulations • 1990 GHG levels targeted by 2020 • Pending CARB draft regulations to stipulate GHG reporting • Media has, at times, inaccurately portrayed all hydropower as an energy resource with high GHG emissions • Recent Sacramento Bee articles cite Shasta & Oroville GHG emissions • Articles cite gross emissions and not emissions/unit power generated • So, DWR undertook this study
What Role Does Hydro Play in GHG Emissions? • Hydropower projects with large reservoirs have some level of GHG emissions; • hydropower projects without reservoirs typically have lower emissions • Published data for hydropower reservoirs and natural lakes in tropical regions show relatively high GHG emissions • comparable to thermal plants – particularly in initial years • Published data for hydropower reservoirs in temperate regions including N. America show relatively low GHG emissions • comparable to wind, solar, and other renewable generating resources
Two Sources of GHG Emissions from Hydropower • Diffusive flux at the reservoir surface – can be either an emission source or a sink that absorbs CO2 • A result of terrestrial geochemical and biological processes and their resulting influence on limnological processes • Degassing flux caused by water being released through the power plant turbines – always an emission source • A result of a decrease in dissolved carbon (DOC/DIC) content • Typically less than diffusive flux
Key Factors Influencing GHG Emissions From Reservoirs • Geographic and climatic influence (boreal, temperate, semiarid, tropical) • Reservoir characteristics (surface area, stratification, vegetation, precip…) • Reservoir age – mature reservoirs generally have lower emissions • Water residence time • Water chemistry • Changes in water chemistry due to type of soils and vegetation inundated • Water temperature • Water depth • Dissolved organic carbon • Dissolved oxygen • Water pH (only statistically relevant variable for Western U.S.) • Wind speed • Microbial productivity and biomass
Estimates of Gross Daily and Annual GHG Emissions for the Oroville Facilities
How Does this Compare with GHG Emissions from Other Energy Sources? (Tremblay, IRN, DWR)
Preliminary Findings • Oroville Facilities have low GHG emissions when compared with fossil-fuel fired generation • Comparable to values published for renewables like wind or solar • Reservoir GHG emissions are site specific due to the complex array of the factors that influence them and the wide variability of site conditions • Industry/international sampling protocols are being developed • Additional sampling at the Oroville Facilities would help to narrow this preliminary estimated range
Additional Thoughts • Most reservoir GHG studies to date have only measured gross flux • Ideally, net studies would be conducted including reservoir footprint before construction • Some studies suggest the carbon cycle for fluvial systems absent reservoirs would ultimately emit and/or absorb similar GHGs • Reservoirs/rivers/lakes are part of the carbon cycle between the earth’s surface and the atmosphere • Fossil fuel power generation introduce carbon into the global cycle long sequestered in the earth’s crust
Global Carbon Cycle Flux • Simplified global carbon cycle flux– 210 billion metric tons annually • Natural fluxes are about 3 billion metric tons net from the atmosphere/yr • Anthropogenic fluxes are about 6 billion metric tons to the atmosphere/yr • Net 3 billion metric ton increase to the atmosphere/yr • Primary anthropogenic GHGs are CO2, CH4, N2O, and CFCs