Download

1 / 9
90 likes | 270 Views
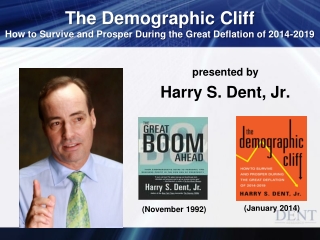
Dent Business Academy Business Strategies for the Winter Season. Harry S. Dent, Jr. Dent Research. Session 4: . S-Curve and Product Life Cycles for Business: Micro Seasons and Strategies. Charts. Radial Tire S-Curve. 90% . Bias-ply Tires. 50% . Radial Tires. 10% . Chart 4 -1.

E N D
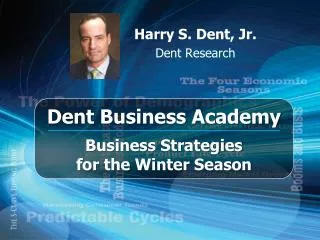
Dent Business Academy Business Strategies for the Winter Season Harry S. Dent, Jr. Dent Research
Session 4: S-Curve and Product Life Cycles for Business: Micro Seasons and Strategies Charts
Radial Tire S-Curve 90% Bias-ply Tires 50% Radial Tires 10% Chart 4-1 Source: Dent Research
The Automobile S-Curve Innovation Growth Maturity 100 90% 99% 99.9% 90 80 70 60 50 50% 40 30 20 10 1% .1% 10% 0 Percent Adoption 14 years 14 years 1900 1907 1942 1914 1928 1921 1935 Installment Financing 90% Urban Adoption Cars only for the Rich Model T Design Assembly Line Chart 4-2
Cell Phone S-Curve Innovation Growth Maturity 100 90% 99% 99.9% 90 80 70 60 50 50% 40 30 20 10 1% 10% 0 2011 Percent Adoption 2008 2005 2003 1999 1997 1996 1994 1991 1984 Chart 4-3
Consumer Adoption Curve Innovation Growth Maturity 100 90% 99% 99.9% 90 80 70 60 50 50% 40 30 20 10 1% .1% 10% 0 Die-hards Results Laggards Late Majority Early Majority Opinion Leaders Influentials Young, Urban High income Group Characteristics Old, Rural Low income Chart 4-4
S-Curve and Four Stages Different Strategies for Each Stage 90% Maturity Boom Mainstream Growth Boom 50% Drives 0%-10% Shakeout Innovation 10% Chart 4-5
Bain Strategy Matrix Race for Leadership Dominate Industry Innovation Stage Purge Chart 4-6 Source: Dent Research