Download
1 / 30
300 likes | 460 Views
EEA scenario 2005 project: “Climate Change and a European low-carbon energy system” Rob Swart, EEA Topic Centre Air and Climate Change (core presentation provided by Hans Eerens). It is not most important to predict the future, but to be prepared for it Perikles (about 500-429 b. Chr.).

E N D
EEA scenario 2005 project: “Climate Change and a European low-carbon energy system” Rob Swart, EEA Topic Centre Air and Climate Change (core presentation provided by Hans Eerens) It is not most important to predict the future, but to be prepared for it Perikles (about 500-429 b. Chr.)
SoEOR2005 SoEOR2005 Air and Climate Change Energy and GHG projections Regional air quality 2000-2030 Some conclusions
ETC/ACC partners and others involved: • RIVM: IMAGE/TIMER/FAIR/EUROMOVE models, global scenarios, climate effects, coordination • NTUA: PRIMES/GEM-E3/PROMETHEUS models, European energy system • IIASA: RAINS model, European air quality • DNMI: EMEP model • AEAT: non-CO2 GHGs and non-energy CO2 emissions • IPTS: POLES model, technology variants • AUTH: OFIS, OSPM model, transport & urban Air Quality • NILU: air Pollution State & policies • CCE: air pollution effects on ecosystems/critical loads • EEA: project guidance, links with issues other than air and climate change
SoEOR2005: series of reports • Climate change and a low-carbon European energy system • European Environmental Outlook • Main SoEOR2005 report (29 November 2005) • Air quality and ancillary benefits of climate policy (December 2005?)
SoEOR2005 Objective ACC Assessment of long-term air pollution and climate change trends and scenarios • Europe (2030) in a global long-term context (2100) • Baseline (no climate action after 2012, moderate high economic growth, based on CAFE scenario) • Climate action scenario (550 CO2eq) assuming EU25 GHG target of -40 % by 2030 (from 1990 levels), combination of domestic action and use of international flexibility mechanisms • Variants (low economic growth path, high renewable/biomass ambitions, increase/decrease use of nuclear energy, Maximum Feasible Reductions AQ)
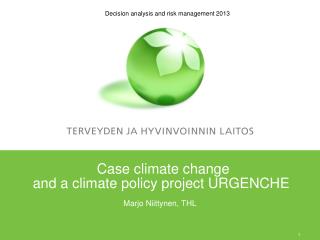
Baseline and climate action scenarios compared to IPCC SRES scenarios Climate action
Impact of a 75 year Convergence and Contraction global burden sharing approach on the GHG emissions ceiling for various world regions
Focus on 2030: avoided CO2 emissions Climate action
Change in emissions of air pollutants in the EU 25 region relative to 2000 Ancillary benefits of climate policy
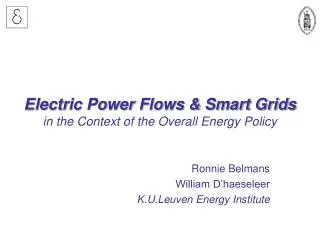
Anthropogenic contribution to modeled grid-average PM2.5 concentrations (annual mean, µg/m3) 2000 2020 CAFE 2030 Climate Action 2030 Climate Action - MFR
Percentage of total ecosystems area receiving nitrogen deposition above the critical loads 2000 2020 CAFE 2030 Climate Action 2030 Climate Action - MFR
Percentage of forest area receiving acid deposition above the critical loads 2000 2020 CAFE 2030 Climate Action 2030 Climate Action - MFR
Loss in statistical life expectancy that can be attributed to the anthropogenic contributions to PM2.5 (in months) 2020 CAFE 2000 2030 Climate Action 2030 Climate Action - MFR
Grid-average ozone concentrations in ppb.days expressed as SOMO35 2000 2020 CAFE 2030 Climate Action - MFR 2030 Climate Action
SoEOR2005: Climate Change and Air Quality Conclusions • Climate action scenario assumes GHG emissions to be reduced by 15-30 [20] % below 1990 levels by 2020 and 60-80 [65] % by 2050. • The analyses suggest that 40 % of the reductions could be achieved cost-effectively by actions outside the EU and that no fundamental transition in Europe’s energy system is needed • The domestic actions have significant ancillary benefits for air quality (yet to be quantified this year) • But to meet AQ objectives, (additional) air pollution policies remain necessary
SCENARIOS FOR SOEOR2005: CONCLUSIONS (II) Climate action
While such a transition can bring enormous benefits, it also presents substantial challenges • Benefits • Decoupling of CO2 emissions from economic growth and reduced European contribution to global climate change • Reduced emissions of air pollutants • Reduced energy import dependency (-20%) • Employment in industrial and agricultural sectors selling biofuels and clean and low energy technologies to Europe and the world • Challenges • Large changes required in the energy sector • Difficult choices over controversial technologies such as nuclear power and carbon capture and storage • Potential for energy efficiency is well-known, but achieving energy reductions in practice will require new policy approaches • Costs may be small in relation to GDP, but are nevertheless large in real terms
Nederland • Bij een gelijke koolstof tax zal NL, naar verwachting, achterblijven in binnenlandse CO2 reduktie vergeleken met het Europees gemiddelde (+2% versus -16% in 2030 tov Kyoto doelstelling) • In combinatie met een Europees beleid voor hernieuwbare brandstoffen (2,5 Eurocent/Kwh in 2020 oplopend tot 5 Eurocent/Kwh in 2030) kan de reduktie oplopen tot -7% voor NL en -23% voor EU25. • Door Europees klimaat beleid kunnen aanzienlijke co-benefits voor luchtkwaliteit worden gerealiseerd (inclusief financiele voordelen).
SoEOR2005: flow chart of models used Economy GEM-E3, PROMETHEUS Transport Agriculture PRIMES COPERT III, TREMOVE, TREND AEA-T model RAINS Emissions CO2 CH4, N2O, (Europe) MERLIN HFC, PFC, SF6 (Europe) EMEP CO2 Permit OFIS Price OPSM POLES TIMER FAIR Regional concen-tration:SO2, NO, NH3, PM, O3 Urban conc. PM, NO2, O3 Sinks Street increments CO2, CH4, N2O, HFC, PFC, SF6 IMAGE Energy Price WaterGap CC impacts AQ impacts
Permit prices assumed Climate action Climate action
Past and projected prices of fossil fuels and electricity 1970-2050
Costs (% of GDP) for various world regions to achieve climate change targets 2020-2100 under the climate action scenario.
Changes in the fuel mix of EU-25 gross inland energy consumption compared to the baseline in 2030
Emission control costs EU-25 billion Euro/year Climate change benefit
Air pollutant land-abatement cost; baseline compared to Climate action