Download
1 / 30
310 likes | 505 Views
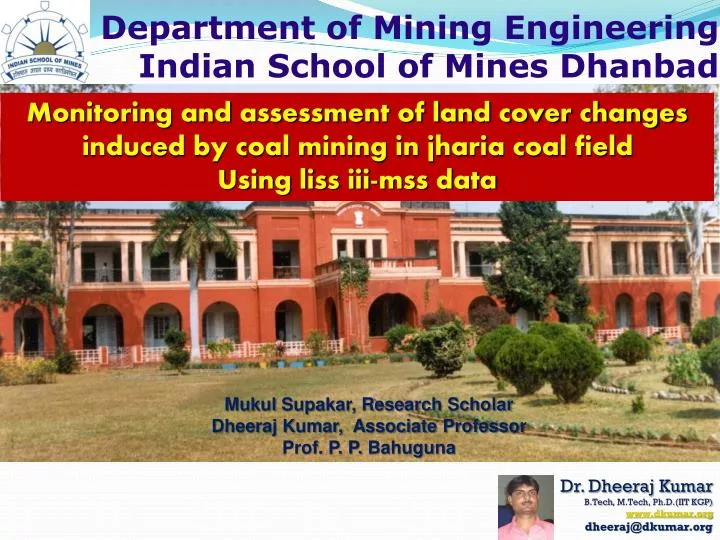
Department of Mining Engineering Indian School of Mines Dhanbad. Monitoring and assessment of land cover changes induced by coal mining in jharia coal field Using liss iii-mss data. Mukul Supakar, Research Scholar Dheeraj Kumar, Associate Professor Prof. P. P. Bahuguna.

E N D
Department of Mining Engineering Indian School of Mines Dhanbad Monitoring and assessment of land cover changes induced by coal mining in jharia coal field Using liss iii-mss data Mukul Supakar, Research Scholar Dheeraj Kumar, Associate Professor Prof. P. P. Bahuguna Dr. Dheeraj Kumar B.Tech, M.Tech, Ph.D.(IIT KGP) www.dkumar.org dheeraj@dkumar.org
DEFINITION OF PROBLEM Problems that attracted us to choose this topic • Effect of mining on vegetation • Socio-economic effect due to mining activity • Global warming • Exploitation of coking coal
OBJECTIVE • Assessment of temporal and spatial land cover (vegetation) change distribution using remotely sensed imagery; • To quantify land-cover changes in terms of percentage of area affected and rates of change • To understand the impact of coal mining on vegetation.
Location of Study Area Jharia Coal Filed(JCF)) Latitude 23-40-00 and 23-50-00 N Longitude 86-10-00 and 86-30-00E [source: www.google.com]
MATERIAL USED • Linear Imaging Self-scanning Sensor (LISS) III- Multi Spectral Scanner (MSS) image taken in 1997, 2001 • LISS-III MSS Panchromatic (PAN) merged image taken in 2004 • Survey of India topo-sheet (1:50000) of JCF for reference data(73l/4, 73I/1, 73I/2, 73I/5)
IDENTIFICATION OF LAND-COVER CLASS FROM SATELLITE IMAGERYOn the FCC of LISS-3 MSS band 4, 3 and 2 (RGB) a) Build- up land b) Barren land c) Mining area d) Water bodies e) Forest area (vegetation) f) Minor vegetation (agriculture and scrubland)
IMAGE DIFFERENCING Image differencing was performed by subtracting the reflectance of the red band of the two imageries, [red reflectance of 2nd imagery (2001) - red reflectance of 1st imagery (1997)] Some dark spot in upper north west corner of the figure is seen showing that there is least change in vegetation as mining activities is minimum and some dense forest is present in that region
SUPERVISED LAND-COVER CLASSIFICATION • Using maximum likelihood classifier • Identification of class from satellite imagery • Photo interpretation from Survey of India (SOI) topo-sheet of Jharia Coal Fields (JCF)
The accuracies of individual categories can be calculated by dividing the number of correctly classified pixels in each category by either the total number of pixels that were classified in that category- producer’s accuracies User’s accuracies are computed by dividing the number of correctly classified pixels in each category by the total number of pixels that were classified in that category. For each class, producer and user accuracy was calculated Overall classification accuracy of 84% and 83% was obtained respectively with overall kappa statistics of 0.79 and 0.785 for the year of 1997 and 2001 imageries respectively.
Descriptive modeling of land-cover change process Markov chain, the land-cover distribution at t2 (2001) calculated from the initial land-cover at t1 (1997) by means of transition matrix. The Markov chain is expressed as: Vt2 = M* V t1 M is a transition matrix for time interval t= t2-t1 (2001-1997=4)
Vt2 is the input land-cover proportion column vectorVt1 is the output land-cover proportion column vector M1 =Mt (1/t) = V*D1/t *V-1t is calibration time interval of the Markov chain,Mt is the transition matrix of the Markov chain for the time interval t,M1 is the transition matrix for an annual transition rate,Where V and D are orthogonal and diagonal (Eigen values) matrices respectively .
Change in land cover proportions over the two pairs of observation years A positive variation of a land-cover proportion shows an increase in area for the land-cover class from the first to the second date
Results • The overall rate of land-cover change for the two time intervals (1997-2001 and 2001-2004) were 29.15% , and 23.82% respectively. • Total land-cover area that remains unchanged is 54.95% (annually) only. • The main driving force for the land-cover change in this region is mining, decrease in rainfall in recent years and growing pressure of population.
Observed land-cover proportion for 1997, 2001, and 2004 in percentage annual rates of land-cover changes in percent for the period of 1997-2004
The main reasons for decrease in vegetation • conversion of vegetation into built-up area, and the probability of this conversion is about 16.02% • probability of conversion of vegetation into mining areas is 8.87% • probability of conversion of vegetation into barren land is also about 13.12%.
Evolution of land-cover proportion projected (p) by Markov model based on observed (o) land-cover proportions in the recent past.
How is the land-cover change process likely to progress in near future? • From 1997 to 2012, this model predicted that the natural vegetation could drop from 43.70% to 29.11% of the study area, • agricultural land would decrease from 14.1% to 10.47%, • barren land would increase from 16.5% to 33.15% and • mining areas would increase from 4.6% to 12.36%. • as the mining areas increases, built-up area would increase from 17.98% to 22.99%.
Validation of results Land-cover proportions projection (P2004) by extrapolation from the 1997-2001 transition matrix, and the observed (O2004)land-cover proportion
land-cover proportions projection (P2008) by extrapolation from the 1997-2001 transition matrix, and the observed (O2008) land-cover proportion.
conclusions • The analysis of land-cover change detection from temporal series of medium-resolution satellite data such as LISS-III MSS data, proved to be very helpful, if the land-cover change detection is quantified in terms of percentage of area affected and the rate of change • The projection of the future land-cover pattern on the basis of Markov chain shows a continuous trend of increase in mining area, barren land, and built-up area where as vegetation is in continuous decreasing trend.
References • Bayarsaikhan,U., Boldgiv,B., Kim,K.R., Park, K.A., Lee,D.,2009,”Change detection and classification of land cover at Hustai National park in Mongolia.” Int. J. Applied Earth Observation and Geoinformation.11:pp.273-280. • Conglton, R.G., and Woodcock, C.E., 1996 “A review of assessing the accuracy of classification of remotely sensed data.” Remote sensing of Environment, 35:pp.35-46. • Green, K., Kempka, D., and Lackey, L., 1994,” Using remote sensing to detect and monitor land-cover and land-use change.” Photo. Eng.and Remote sensing, 60: pp.331-337. • Mihai, B., Savulescu, I., and Sandric, I., 2007, “Change detection analysis(1986-2002) of vegetation cover in Romania.” Mountain Research and Development.27. • Petit, C., Scudder, T., and Lambin, E., 2001,”Quantifying process of land-cover change by remote sensing resettlement and rapid land-cover change in Southern Zambia.” Int. Journal of Remote sensing, 22: pp 3435-3456. • Singh, A. 1989. “Digital change detection techniques using remotely-sensed data.” Int. J. Remote Sensing, 10: pp.989-1003.