Download
1 / 59
590 likes | 772 Views
The IPCC Fourth Assessment Report (AR4) Process, and Climate Change Contributions from CCSM3 Gerald A. Meehl NCAR Boulder, CO. The IPCC Fourth Assessment Report (AR4)

E N D
The IPCC Fourth Assessment Report (AR4) Process, and Climate Change Contributions from CCSM3 Gerald A. Meehl NCAR Boulder, CO
The IPCC Fourth Assessment Report (AR4) The Intergovernmental Panel on Climate Change (IPCC) consists of about 190 governments that commission assessments performed by the international climate science community on the state of human knowledge of climate and climate change Working Group 1: Climate science Working Group 2: Climate impacts and adaptation Working Group 3: Mitigation
An assessment is different from a review! A review compiles work in a certain area An assessment compiles work in a certain area, evaluates that work, and comes to conclusions regarding our state of knowledge and understanding at that point in time. Subsequent assessments change with advances in our understanding An IPCC assessment is policy relevant but not policy prescriptive
Apr 2003 1st Scoping meeting Sep 2003 2nd Scoping meeting Nov 2003 IPCC approval of outline ……. Climate sensitivity workshop (July, 2004, Paris) Sep 2004 1st LA meeting (Italy) …… Zero order draft, internal review Mar 2005 May 2005 Model analysis wkshp, IPRC, Hawaii 2nd LA meeting (Beijing) …… 1st draft due Aug. 12; expert review Dec 2005 3rd LA meeting (New Zealand) …… 2nd draft due Mar. 3, Govt/expert rev Jun 2006 4th LA meeting (Norway) …… 3rd draft due Sep 15; review of SPM Jan 2007 IPCC WG1 approval AR4 WG1 timetable All new model runs needed for WGI Documentation needed (papers submitted to journals) by May 31 All papers/documentation in press or appeared by December 15
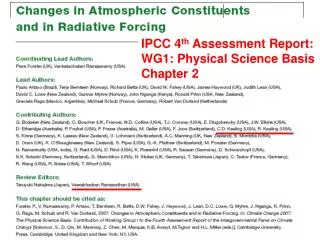
Working Group I Contribution to the IPCC Fourth Assessment Report Climate Change 2007: The Physical Science Basis Chapter 1: Historical Overview of Climate Change Science Chapter 2: Changes in Atmospheric Constituents and in Radiative Forcing Chapter 3: Observations: Surface and Atmospheric Climate Change Chapter 4: Observations: Changes in Snow, Ice and Frozen Ground Chapter 5: Observations: Oceanic Climate Change and Sea Level Chapter 6: Paleoclimate Chapter 7: Couplings Between Changes in the Climate System and Biogeochemistry Chapter 8: Climate Models and their Evaluation Chapter 9: Understanding and Attributing Climate Change Chapter 10: Global Climate Projections Chapter 11: Regional Climate Projections
The IPCC AR4 has motivated the formulation of the largest international global coupled climate model experiment and multi-model analysis effort ever attempted, and is being coordinated by the WGCM Climate Simulation Panel Fourteen modeling groups from around the world are participating with 21 models; considerable resources have been devoted to this project; PCMDI has archived ~27 TeraBytes of model data so far From over 60 proposals submitted, funding for 18 analyses of the 20th century climate simulations was provided by NSF-NOAA-NASA-DOE under the Climate Model Evaluation Project (CMEP) and coordinated by U.S. CLIVAR
CCSM3 has made the largest contribution of any single model to the IPCC AR4 multi-model dataset with 8 ensemble members (5 for A2) at T85 for each experiment (about 30% of the PCMDI multi-model archive, or ~7.5 TeraBytes out of the total archive of ~27 TeraBytes) Five members were run in the U.S. at NCAR, Oak Ridge National Laboratory (ORNL), and the National Energy Research Scientific Computing Center (NERSC); Three members were run in Japan on the Earth Simulator, along with some unique “overshoot” scenarios (Tsutsui et al., 2005)
Results from analyses of the multi-model dataset were presented by 125 scientists at a workshop convened by US CLIVAR and hosted by IPRC (Univ. of Hawaii) March 1-4, 2005, and are feeding directly into the AR4 assessment process To date, there are 306 analysis projects registered at PCMDI, and over 220 papers have been submitted to peer-reviewed journals with results from multi-model analyses for assessment in the IPCC AR4
Results from analyses of the multi-model dataset were presented by 125 scientists at a workshop convened by US CLIVAR and hosted by IPRC (Univ. of Hawaii) March 1-4, 2005, and are feeding directly into the AR4 assessment process To date, there are 306 analysis projects registered at PCMDI, and over 220 papers have been submitted to peer-reviewed journals with results from multi-model analyses for assessment in the IPCC AR4 This is more than double our most optimistic estimate for participation
Equilibrium climate sensitivity from 17 models currently in use for the IPCC AR4 (CCSM3=X)
A2 = 2.26XCO2 A1B = 1.89XCO2 B1 = 1.51XCO2 (Meehl et al., 2005, J. Climate special issue paper)
CCSM3 (Meehl et al., 2005, J. Climate special issue paper)
CCSM3 (Meehl et al., 2005, J. Climate special issue paper)
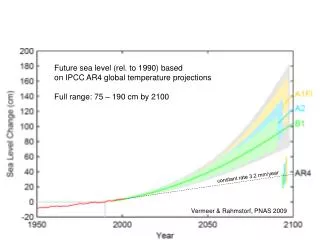
Climate change commitment: at any point in time, we are committed to additional warming and sea level rise from the radiative forcing already in the system. Warming stabilizes after several decades, but sea level from thermal expansion continues to rise for centuries. (Meehl et al., 2005: How much more warming and sea level rise? Science, 307, 1769—1772)
Higher climate sensitivity = greater response Stronger mean MOC = greater ventilation and less commitment (CCSM3 = 22 Sv, PCM = 32 Sv) Greater percent decrease in MOC = less ventilation and longer timescales of MOC recovery and commitment CCSM3: -18% to –28% PCM: -3% to –14%
CCSM3 SUM(JAS) Sea Ice Concentration (Teng et al., 2005, Cli. Dyn., submitted)
Global avg TAS and Sea Level Change (Teng et al., 2005, GRL, submitted)
Summary • First drafts of IPCC AR4 chapters are being formulated, with eventual publication in spring, 2007 • CCSM3 has made the largest contribution from any single model to the multi-model dataset being assessed for the AR4, with eight ensemble members of all experiments (five for A2), ~7.5 TeraBytes out of the total PCMDI multi-model archive of ~27 Terabytes (~30%)
Summary (continued): • 3. A major international multi-model data collection and analysis effort has yielded over 220 papers now being assessed for the AR4 • 4. The large set of climate change experiments performed with the CCSM3 will continue to constitute a major resource for analysis of aspects of climate change for the next several years, as will the multi-model dataset of which CCSM3 is a part (maintained at PCMDI, and analysis projects will continue to be registered by the WGCM Climate Simulation Panel for the foreseeable future)
Chapter 10: Global Climate Projections Coordinating Lead Authors: Gerald Meehl (USA), Thomas Stocker (Switzerland) Lead Authors: William Collins (USA), Pierre Friedlingstein (France), Amadou Thierno Gaye (Senegal), Jonathan Gregory (United Kingdom), Akio Kitoh (Japan), Reto Knutti (Switzerland), James Murphy (United Kingdom), Akira Noda (Japan), Sarah Raper (Germany), Ian Watterson (Australia), Andrew Weaver (Canada), Zong-Ci Zhao (China) Review Editors: Myles Allen (United Kingdom), Govind Ballabh Pant (India)
Natural forcings do not fully explain observed late 20th century warming(uncertainty in climate model response is reduced by demonstrating that 20th century temperatures are directly related to the relevant forcings) • Climate models with only “natural” forcings (volcanic and solar) do not reproduce observed late 20th century warming • When increases in anthropogenic greenhouse gases and sulfate aerosols are included, models are able reproduce observed late 20th century warming Meehl, G.A., W.M. Washington, C. Ammann, J.M. Arblaster, T.M.L. Wigley, and C. Tebaldi, 2004: Combinations of natural and anthropogenic forcings and 20th century climate. J. Climate, 17, 3721-3727.
Ch. 10: Global Climate Projections • What’s new? • Climate change commitment a major new theme in the multi-model experiments • Additional understanding and quantification of uncertainty —e.g. parameter uncertainty, forcing uncertainty • More quantitative estimates of climate sensitivity and TCR (range and probabilities) • More multi-model results and multi-member ensembles (probabilistic estimates of climate change) • More results on extremes
Climate change commitment: at any point in time, we are committed to additional warming and sea level rise from the radiative forcing already in the system (Meehl et al., 2005: How much more warming and sea level rise? Science, 307, 1769—1772)
Climate models can be used to provide information on changes in extreme events such as heat waves Heat wave severity defined as the mean annual 3-day warmest nighttime minima event Model compares favorably with present-day heat wave severity In a future warmer climate, heat waves become more severe in southern and western North America, and in the western European and Mediterranean region Meehl, G.A., and C. Tebaldi, 2004: More intense, more frequent and longer lasting heat waves in the 21st century. Science, 305, 994--997. Observed Model Future
80% probability of at least this surface temperature change from 9 models for 2XCO2: probability of temperature change exceeding 2°C from 9 models for 2XCO2: (from Furrer et al., 2005)
Summary • IPCC AR4 is underway, with eventual publication in spring, 2007 • For Ch. 10 as an example, climate change commitment is a major new theme in multi-model experiments • Additional understanding and quantification of uncertainty —e.g. parameter uncertainty, forcing uncertainty • More quantitative estimates of climate sensitivity and TCR (range and probabilities) • More multi-model results and multi-member ensembles (probabilistic estimates of climate change) • More results on extremes
Changes in frost days in the late 20th century show biggest decreases over the western and southwestern U.S. in observations and the model
Future changes in frost days from the climate model show greatest decreases in the western and southwestern U.S., similar to late 20th century
Large-scale changes in atmospheric circulation affect regional pattern of changes in future frost days Anomalous ridge of high pressure brings warmer air to northwestern U.S.causing relatively less frost days compared to the northeastern U.S. where an anomalous trough brings colder air from north H cold L warm (Meehl, Tebaldi and Nychka, 2004: Changes in frost days in simulations of twentyfirst century climate, Climate Dynamics, 23, 495--511)
“…the previous estimated range for [equilibrium climate sensitivity], widely cited as +1.5 to +4.5°C, still encompasses the more recent model sensitivity estimates.” “The range of transient climate response for current AOGCMs is +1.1 to +3.1°C” ---IPCC Third Assessment Report, 2001
Equilibrium climate sensitivity from 17 models currently in use for the IPCC AR4 Transient climate response (TCR) from 17 models
Based on 17 AOGCMs currently in use for the IPCC AR4: The 5-95% uncertainty range for equilibrium climate sensitivity is 2.0-4.4⁰C, with median value of 3.1⁰C
The 5-95% uncertainty range for TCR 1.3-2.2⁰C, with a median value of 1.7⁰C
Equilibrium climate sensitivity from a large number of perturbed parameter ensembles Weighted: 5% - 95% range: 2.4° - 5.4 °C, median: 3.5 °C Murphy et al., 2004
Climate sensitivity from LGM paleoclimate simulations Using estimates of tropical cooling and multiple climate model simulations, estimate equilibrium climate sensitivity 5% to 95% range of 1.5 ° to 4.7 °C, with best guess between 2.1 ° and 3.6 °C Schneider von Deimling et al., 2004
A climate model that can accurately simulate response to Pinatubo eruption has an equilibrium climate sensitivity of about 3.1⁰C Soden et al., 2002
Globally averaged surface temperature time series from three models (PCM, GFDL, HadCM3) for multiple forcings (top), natural forcings only (middle), and simulations with A2 scenario to 2100 (from Stott et al., 2005)
Observationally constrained range Raw range Globally averaged surface temperatures for A2 from three models for raw projections (dashed), best fit observationally constrained projections (thick solid), and 5 to 95 percentile uncertainty ranges (thin solid) from Stott et al. (2005)