Download
1 / 19
190 likes | 288 Views
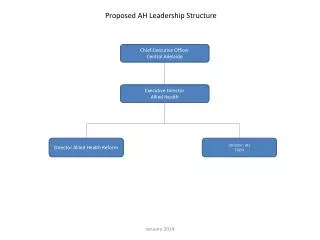
Benchmarking, Quality, and the Connected Community. Tom Liddell, Executive Director Michiana Health Information Network. Introduction. Today’s Agenda 5 Steps to Analytics Actionable Data Case Studies Trended Quality vs. Real Time Clinical Quality How to Measure Quality.

E N D
Benchmarking, Quality, and the Connected Community Tom Liddell, Executive Director Michiana Health Information Network
Introduction Today’s Agenda • 5 Steps to Analytics • Actionable Data Case Studies • Trended Quality vs. Real Time Clinical Quality • How to Measure Quality
Level 5: Self to Peer Comparative Analytics Level 4: Aggregated Comparison Analytics Level 3: Aggregated Analytics Level 2: Single Event Analytics Level 1: Data on the move 5 Steps to Analytics Move. Measure. Monitor. React.
Level 1: Leveraging data movement Move. Measure. Monitor. React. • Get data on the move. • Inventory all clinical and financial data available. • Understand the value of discrete data. • Embrace the information exchange of data. • Make it available through product integration. Level 1: Data on the Move
Level 2: Single Event Analytics Level 2: Leveraging data movement for basic analytics Move. Measure. Monitor. React. 2. Single-event analytics = Measuring events that seem out of scope • Can be measured through: • Results delivery • Interface integration • Printed report • Charting Level 1: Data on the Move
Level 4: Aggregated Comparison Analytics Level 3: Aggregated Analytics Levels 3 & 4: Trending and internal comparisons Move. Measure. Monitor. React. • Aggregated Comparison Analytics • Investigate inside the trends • Utilize peer to peer comparisons with providers in your organization. • 3. Aggregated Analytics • Measure trends with your organization. • Single-unit trending
Level 5: Self to Peer Comparative Analytics Level 5:Outside comparative analytics Move. Measure. Monitor. React. 5. Self to Peer Comparative Analytics • Compare your organization or individuals in your organization with like communities, like states, like regions, etc. • Ask: How do I stack up?
Improve Healthcare and Provider Satisfaction Quicker access to more complete patient information and histories Enhance quality and safety Comprehensive Result Distribution and Clinical Messaging Complete interoperability for all data sources to EHRs Meet Meaningful Use and Other HIE Requirements Cross Connect to State and other infrastructures as required Maintain local control and governance of your Health Information 1 2 3 5 Actionable Data:Health Information Exchange Analytics
Compression for all clinical information at the time of care Comprehensive orders, referrals, results Vendor management Smart clinical workflow support Project management 1 2 3 5 Actionable Data:Health Information Exchange Analytics Physician and Clinical Staff Goals for HIE and Integration
1 2 3 5 Actionable Data:Health Information Exchange Analytics What does that look like for a doctor? • Compression for all clinical information at the time of care • Comprehensive orders, referrals, and results • Measurable, discrete data • Community view of relevant patient information • Real-time alerts
1 Actionable Data: Sepsis Rescue Agent 4
1 3 5 Actionable Data: HealthcareND HealthCAREND
HealthCareND 5 Actionable Data: HealthcareND
5 Actionable Data: HealthcareND Personalized Medicine: Merging EHR and Genetic Networks Disease Networks from EHR Genetic factors
1 2 3 5 Actionable Data:Benchmarking/ Peer to Peer Analytics 4 • Aggregated analytics for your hospital Benchmarking
Getting to Utopia:Real Time Clinical Quality • Comprehensive results into physician EHRs • Real time analytics • You drive your own quality measures– not your insurance companies. Your data, in your community, helping you to improve your service to your patients.
Level 5: Self to Peer Comparative Analytics Level 4: Aggregated Comparison Analytics Level 3: Aggregated Analytics Level 2: Single Event Analytics Level 1: Data on the move Getting to Utopia:Real Time Clinical Quality
Remember: Move. Measure. Monitor. React. Thank you. Questions? toliddell@mhin.com