Download
1 / 17
170 likes | 302 Views
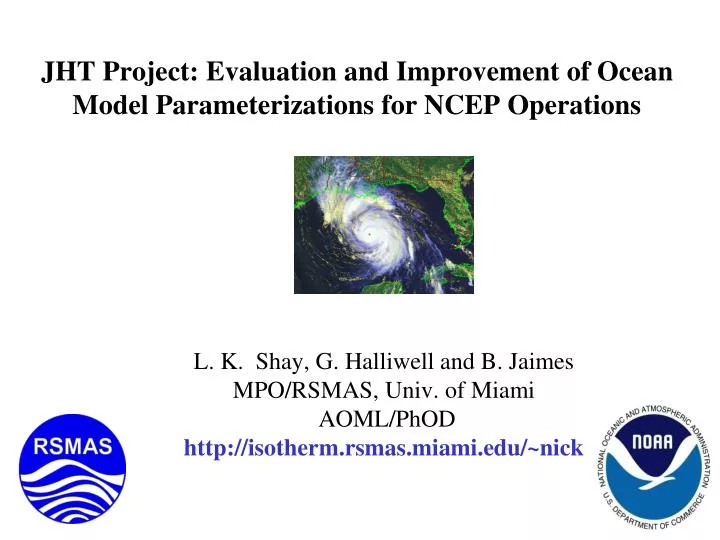
JHT Project: Evaluation and Improvement of Ocean Model Parameterizations for NCEP Operations. L. K. Shay, G. Halliwell and B. Jaimes MPO/RSMAS, Univ. of Miami AOML/PhOD http://isotherm.rsmas.miami.edu/~nick. Outline:. Cold and Warm Core Eddies -Ivan (04)

E N D
JHT Project: Evaluation and Improvement of Ocean Model Parameterizations for NCEP Operations L. K. Shay, G. Halliwell and B. Jaimes MPO/RSMAS, Univ. of Miami AOML/PhOD http://isotherm.rsmas.miami.edu/~nick
Outline: • Cold and Warm Core Eddies -Ivan (04) • Loop Current/Warm Core Eddy Interactions (deep OML) • 1. Katrina and Rita (05) (Idealized Simulations) • 2. Gustav and Ike (08) • Preliminary Comparison to Navy/NOAA Models Using DWH T(z) Data (Assimilation Versus Non Assimilation) • 2011 HFP with NOAA IFEX/ DOI BOEMRE/NSF • Summary • Recurrent Theme: • 3-D Upper ocean observations are critical in understanding • the response and interactions with atmosphere.
Ivan (2004) over the GOM SSH (cm) from HYCOM (from Halliwell et al., MWR, 2008). NRL SEED Mooring data provided by Bill Teague (NRL-Stennis) SST Analyses Northern Cyclone Southern Cyclone
Vertical Mixing Observed Conclusion: KPP mixing produces the most realistic shear response. Other two choices under- estimate entrainment, which reduces mixed layer deepening and SST cooling. KPP (control) Mellor-Yamada GISS
Drag Coeff. Parameterization Observed Conclusion: parameter- izations that yield coefficients between 2 x 10⁻³ and 2.6 x 10⁻³ at high wind speeds produce the most realistic shear response. Larger (smaller) coefficient Values increase (decrease) mixed layer deepening and SST cooling Powell et al. Donelan et al. (control) Large and Pond
Ivan Model Summary Ivan a clear example of negative feedback(wake cooling/mixing induced by strong winds and Cold Core Ring) as opposed to positive feedback over the Loop Current and Warm Core Rings. Relative to the NRL ocean measurements in Ivan: • Simulated shear response is a stringent test of model performance • KPP mixing outperforms Mellor-Yamada and GISS • Drag coefficient parameterizations that yield values between 2.0 x 10⁻³ and 2.6 x 10⁻³ (e.g. Donelanet al.) outperform those that yield larger or smaller values • No need to use vertical resolution of < 10 m with KPP mixing • Same conclusions realized at other SEED moorings (not shown) • Model evaluation must be extended to other storms and to differing ocean regions Katrina and Rita (05); Gustav and Ike (08); Frances (2004)
The 2005 Loop Current System experiment twice the radius of maximum winds • Seawater temperature and conductivity data from four airborne surveys. • Mooring data: velocity, temperature, and conductivity at ~10 m intervals. Moorings CCE2 For the first time, the ocean response to major hurricanes was simultaneously measured inside cyclonic and anticyclonic geostrophic features. LC WCE CCE1
TC-induced cooling in geostrophic eddies CCE: T ~ -4.5oC Loop Current bulge: T ~ -1oC 26oC 26oC cluster-averaged temperature profiles (Hurricane Rita) Jaimes and Shay, MWR, 2009
Modelapproach • Isopycnic model (MICOM) to suppress spurious vertical mixing. • Idealized, though very realistic quasi-geostrophic vortices. • Turbulence closure for the oceanic mixed layer (OML) that considers wind erosion and vertical shear at the OML base and in the stratified ocean underneath. • Constant wind stress fields from direct measurements during Katrina. WCE1 CCE1 CCE2 WCE2 Jaimes et al. 2011 (JPO: in review)
Model Characteristics • 47 isopycnic layers. • Initial temperature and density fields from WP-3D data acquired after Katrina. • High vertical resolution below the OML and over the thermocline (10 m, similar to vertical resolutions in MMS moorings). Observations Model WCE CCE Jaimes et al. 2011 (JPO: in review)
OML cooling • Realistic OML cooling of less than 1.2oC in WCEs, and of about 4oC in CCEs. • More intense OML cooling over more energetic WCEs and CCEs (right panels). • More and less intense OML cooling over CCEs and WCEs, respectively, compared with quiescent background conditions. WCE1 WCE2 CCE1 CCE2 Jaimes et al. 2011 (JPO: in review)
Quasi-geostrophic vortices transport the temperature anomaly caused by tropical cyclones, distorting the cold wake. Stationary vortices (f-plane) Freely propagating vortices (β-plane) CCE1 CCE2 Black circles represent the initial position of the vortices. Jaimes et al. 2011 (JPO: in review)
Katrina and Rita Model Summary • Horizontal convergence of warm water under the storm’s eye. • Wind erosion occurs over a warm, deep, and nearly homogeneous water column. • Kinetic energy injected by the tropical cyclones is rapidly dispersed, which reduces vertical shears and mixing in the upper ocean. WCEs ΔT < -1oC • Upwelling of cold water under the storm’s eye. • Wind erosion takes place over a a shallow OML and over a near-surface water column with sharp vertical thermal gradients. • Kinetic energy injected by the storm is trapped in upper layers that increase vertical shears and mixing. • High quality ocean observations are critically important for model evaluations (e.g., NOAA IFEX, BOEMRE summer) CCEs ΔT ~ -4oC
NOAA WP-3D profiling over BOEMRE Moorings (NOAA IFEX, HFIP) Deliverables include: V, T, S profiles to 1000 m @ 2-m resolution. Surface winds (SFMR, GPS) provided by HRD. Atmospheric profiles of V, T and RH @ 5-m resolution. Expendables deployed from P-3 and proposed moorings relative to the LC, WCE and CCE superposed on late Sept 05 altimetry derived 26oC isotherm Depth (After Rita).