Download
1 / 27
270 likes | 290 Views
This study examines the use of the RegCM3 model to simulate the climate patterns in the Source Region of Yellow River, located in the Tibet Plateau. The study evaluates the model's performance in reproducing precipitation and temperature distributions, variability, and extreme indices. The results show that the model has a wet bias and cold bias, but overall captures the interannual variability and annual cycle of both precipitation and temperature. The study emphasizes the importance of regional climate models in understanding the climatic features of complex terrains.

E N D
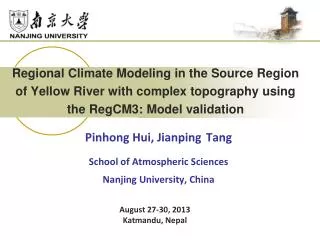
Regional Climate Modeling in the Source Region of Yellow River with complex topography using the RegCM3: Model validation Pinhong Hui, JianpingTang School of Atmospheric Sciences Nanjing University, China August 27-30, 2013 Katmandu, Nepal
Content • Introduction • Experiment design • Observed data • Simulation result • Climatology • Variability • PDFs and quantiles • Extreme indices • Summary
Introduction • The Tibet Plateau • The highest plateau all over the world • complex topography and fragile ecosystem • one of the most sensitive areas to climate change • The Source Region of Yellow River • located in the Tibet Plateau • climatology may have dramatic impact on hydrology and ecosystem over the whole Yellow River Basin • Spatial distribution of precipitation and temperature • displays a strong relationship with the topography in scale under 10km • However, most of this region lacks meteorological observations • Use of regional climate models(RCMs) • necessary for reproducing the main climatic features in complex terrain
Introduction • The regional climate models has been successfully applied in many regional climate studies around the world • Heikkila et al. (2011) did dynamical downscaling of the ERA-40 reanalysis with the WRFV • Afiesimama et al. (2006) use the RegCM3 to study the West African monsoon • Dimri and Ganju (2007) simulated wintertime Seasonal Scale over Western Himalaya Using RegCM3 • Park et al. (2008) Characteristics of an East-Asian summer monsoon climatology simulated by the RegCM3 • Caldwell et al. (2009) Evaluation of a WRF dynamical downscaling simulation over California • …... • There is little research work on regional climate modeling in the Source Region of Yellow River with high resolution using the RegCM3 model
Experiment design • First figure: the larger domain with 45km resolution covering the whole China with a 15km nest covering the Source Region of Yellow River • Second figure • shaded color: terrain height in the nest • large red rectangle: analysis domain(92-106°E, 29-39°N) • black contour line: location of the Source Region of Yellow River • small red circles: surface observation stations
Observed data • Daily surface observations from the China Meteorological Administration (CMA) • Precipitation • surface air temperature • daily maximum and minimum surface air temperature • Consists of 756 meteorological stations, covering the whole country and provides the best data available for China • 116 stations included in our analysis domain • Interpolated the model results onto the station locations and evaluated the quality of the simulations
precipitation bias • high-resolution, remarkable improvement • 15km simulation • bias and RMSE, much smaller • spatial correlation coefficient, much higher • Overestimation , especially in winter • Source Region of Yellow River, better simulated • Largest bias, Qaidam Basin • Underestimation, Tanggula Mountain, Sichuan Basin
surface air temperature bias • 15km simulation outperforms the 45km simulation, especially in the Source Region of Yellow River • higher spatial correlation coefficient • lower bias and RMSE • cold bias • Maximum bias, surroundings of Tanggula Mountain • locations of cold bias are in good agreement with the wet bias regions
Precipitation and surface air temperature at different surface elevations
Inter annual variability of precipitation and surface air temperature averaged over the whole analysis domain
Taylor Diagram of interannual variability in the 12 surface stations in the Source Region of Yellow River
Annual cycle of precipitation and surface air temperature averaged over the whole analysis domain
PDFs of daily mean precipitation over the whole analysis region and the Source Region of Yellow River
Quantiles (0.025, 0.1, 0.25, 0.5, 0.6, 0.7, 0.8, 0.9, 0.95 and 0.99) of daily mean precipitation
PDFs of daily mean surface air temperature over the whole analysis region and the Source Region of Yellow River
Quantiles (from 0.05 to 1 in steps of 0.05) of daily mean surface air temperature
Summary • The RegCM3 model displays wet bias and cold bias with a better performance in the Source Region of Yellow River. And the wet bias is significantly larger in percent during winter • The model accurately captures the interannual variability and annual cycle of both precipitation and temperature averaging over the entire region with high correlation coefficients • It can also well simulate the probability distribution (PDFs) of precipitation but underestimate the extreme precipitation in summer and overestimate it in winter. The simulated temperature PDFs are shifted towards the lower temperatures • The RegCM3 model generally reproduces the spatial patterns of the extreme indices of precipitation and temperature but tends to overestimate the heavy rainfall and cold days • The simulation ability is improved in a great degree over Source Region of Yellow River by using higher resolution