Download
1 / 24
240 likes | 363 Views
Statistics review. Basic concepts: Variability measures Distributions Hypotheses Types of error. Common analyses T-tests One-way ANOVA Two-way ANOVA Regression. Variance. S 2 = Σ (x i – x ) 2 n-1. x. S 2 = Σ (x i – x ) 2 n-1. Variance.

E N D
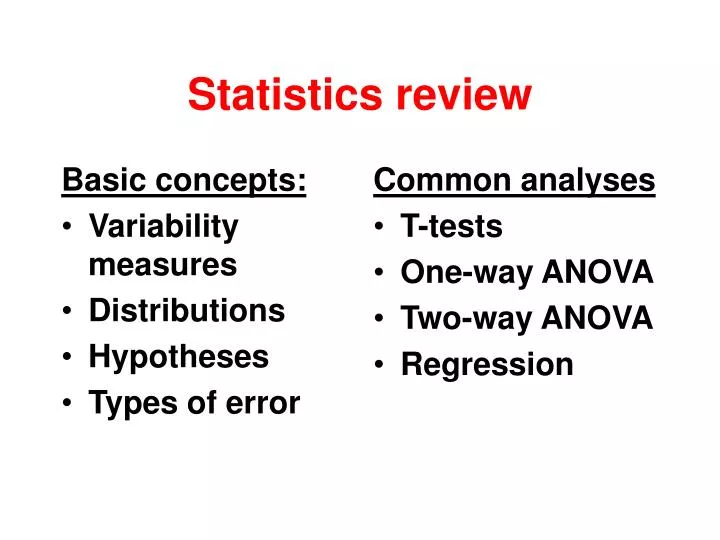
Statistics review Basic concepts: • Variability measures • Distributions • Hypotheses • Types of error • Common analyses • T-tests • One-way ANOVA • Two-way ANOVA • Regression
Variance • S2= Σ (xi – x )2 • n-1 x
S2= Σ (xi – x )2 • n-1 Variance What is the variance of 4, 3, 3, 2 ? 2/3
Variance variants 1. Standard deviation (s, or SD) = Square root (variance) Advantage: units
Variance variants 2. Standard error (S.E.) = s n Advantage: indicates reliability
How to report • We observed 29.7 (+ 5.3) grizzly bears per month (mean + S.E.). • A mean (+ SD)of 29.7 (+ 7.4) grizzly bears were seen per month + 1SE or SD - 1SE or SD
Distributions Normal • Quantitative data Poisson • Count (frequency) data
Normal distribution 67% of data within 1 SD of mean 95% of data within 2 SD of mean
Poisson distribution mean Mostly, nothing happens (lots of zeros)
Poisson distribution • Frequency data • Lots of zero (or minimum value) data • Variance increases with the mean
What do you do with Poisson data? • Correct for correlation between mean and variance by log-transforming y (but log (0) is undefined!!) • Use non-parametric statistics (but low power) • Use a “general linear model” specifying a Poisson distribution
Hypotheses • Null (Ho): no effect of our experimental treatment, “status quo” • Alternative (Ha): there is an effect
Hypotheses Null (Ho) and alternative (Ha): always mutually exclusive So if Ha is treatment>control…
Whose null hypothesis? Conditions very strict for rejecting Ho, whereas accepting Ho is easy (just a matter of not finding grounds to reject it). A criminal trial? Environmental protection? Industrial viability? Exotic plant species? WTO?
Types of error Reject Ho Accept Ho Ho true Ho false
Types of error • Usually ensure only 5% chance of type 1 error (ie. Alpha =0.05) • Ability to minimize type 2 error: called power
Statistical tests All ask: does rejecting Ho help explain some of the variance in the world? NO YES Categorical treatments A B Ho DATA Continuous treatments A B
The t-test Asks: do two samples come from different populations? YES NO DATA Ho A B
The t-test Depends on whether the difference between samples is much greater than difference within sample. A B Between >> within… A B
sp2 + sp2 n1 n2 The t-test T-statistic= Difference between means Standard error within each sample
sp2 + sp2 n1 n2 The t-test How many degrees of freedom? (n1-1) + (n2-1)
The t-test Can also compare a sample to an expected value: Ho Ha DATA • What is the formula?
T-tables Two samples, each n=3, with t-statistic of 2.50: significantly different?
If you have two samples with similar n and S.E., why do you know instantly that they are not significantly different if their error bars overlap?