Download
1 / 23
230 likes | 243 Views
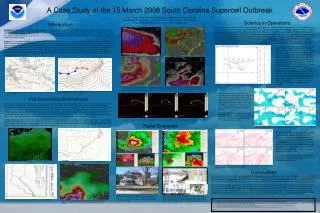
A Case Study of the 15 March 2008 South Carolina Supercell Outbreak. Michael W. Cammarata, Anthony W. Petrolito, Hunter Coleman NOAA/National Weather Service, Weather Forecast Office, Columbia, South Carolina David A. Glenn NOAA/National Weather Service, Weather Forecast Office,

E N D
A Case Study of the 15 March 2008 South Carolina Supercell Outbreak Michael W. Cammarata, Anthony W. Petrolito, Hunter Coleman NOAA/National Weather Service, Weather Forecast Office, Columbia, South Carolina David A. Glenn NOAA/National Weather Service, Weather Forecast Office, Gray, Maine
Introduction • A significant tornado outbreak occurred 15 March 2008 across the NWS Columbia, SC forecast area. • Seven long-track supercells. • Numerous minor tornadoes; several strong (EF2-EF3) tornadoes • 40 million dollars in damage. • Multiple reports of golf ball size hail. • Significant structural damage in Prosperity and Branchville, SC.
Purpose • Show synoptic and mesoscale environmental conditions preceding tornadogenesis across the National Weather Service Columbia area of responsibility. • Evaluate a hodograph technique specified by Esterheld and Guiliano (2008). • Demonstrate the importance of viewing gridded mesoanalysis fields of relevant pre-storm elements as related to the threat of a significant severe event…in particular, the Significant Tornado Parameter and the Craven Brooks SigSvr Parameter
NWSFO CAE South Carolina tornado tracks with annotated Enhanced-Fujita scale ratings
Pre-Convective Environment • Low pressure system in the upstate of South Carolina with a warm front extending eastward across northern South Carolina and a cold front extending southwestward across central Georgia. • Temperatures in the warm sector were in the mid to upper 70s, while north of the warm front temperatures were in the mid 60s. • Southerly flow allowed dewpoints to reach the lower 60s by the afternoon. • LCL was low for this event, generally around 1000 m. • WFO CHS released a special 1800 UTC sounding which revealed a cap around 800 hPa and moderately high storm relative helicity values. • Storms initiated where Lifted Index values exceeded -6 °C and CAPE values were around 2000 J/Kg. • There was sufficient shear to support supercell development, with the 0-6 km shear vector oriented from the west-southwest at around 70 kts (supercells associated with values > 35-40 kts), while Energy Helicity Index values exceeded 5 m²sˉ² (tornadoes in supercells associated with values greater than 1-2).
Pre-Convective Environment • The nose of an upper level jet, and the left entrance region of the jet, were forecast to move over South Carolina during the afternoon of the event. • An 850 hPa low level jet, in excess of 40 kts, was also forecast across the state during the afternoon hours. • The NAM, GFS, and local WRF were in good agreement in forecasting significant shear with 0-6 km helicity values exceeding 700 m²sˉ².
Surface analysis with background MSLP (hPa) and surface winds (kts) 15 March 2008 valid 2100 UTC
LAPS surface dewpoint analysis (oF) 15 March 2008 valid 2100 UTC.
LAPS surface based LI (oC black dashed) and Energy Helicity Index m²sˉ² (image) 15 March 2008 valid 1900 UTC
2100 UTC NAM 3-hr forecast 200-300 hPa wind speed (kts) and direction 15 March 2008 valid 2100 UTC
NAM 3-hr forecast 500 hPa vorticity 10ˉ5sˉ¹ 15 March 2008 valid 2100 UTC
NAM 00-hr forecast 700-500 hPa omega (µ sˉ¹) 15 March 2008 valid 1800 UTC
NAM 3-hr forecast 850 hPa wind speed (kts) and direction 15 March 2008 valid 2100 UTC
15-hr forecast hodographs 15 March 2008 valid 2100 Local WRF GFS NAM
Esterheld and Giuliano (2008) • Hypothesized that significant tornadic supercells exhibit a hodograph with a prominent kink separating primarily speed shear from directional shear. • Strong nearly straight-line hodographs below 500 m AGL with storm relative inflow winds orthogonal to the base of the hodograph at 10 m were found to differentiate between non-tornadic and tornadic supercells. • Inflow angles between 80 and 100 degrees represented the highest frequency of storms that produced significant (EF2+) tornadoes.
Observed hodograph from Columbia, SC (KCAE) VAD wind profile data 15 March 2008 valid 2025 UTC A kink above 500 m, where primarily speed shear transitioned to directional shear Nearly straight-line hodograph from the surface to 500 m The low level hodograph is approximately orthogonal to the storm relative inflow vector
Significant Tornado Parameter • The Significant Tornado Parameter is a multi-ingredient parameter • 0-6 km bulk wind difference • 0-1 km storm-relative helicity • surface parcel CAPE • surface parcel CIN • surface parcel LCL height • (Thompson et. al. 2004) … significant tornadoes (F2 and greater) associated with STP values greater than 1 while values less than 1 associated with non-tornadic supercells. • On 15 March, CIN values were relatively low and varied between 25 and 100 J/Kg, while STP values exceeded 2-3 across the county warning area with a maximum of 5 at 2200 UTC across the southern Central Savannah River area.
2000 UTC 2100 UTC a b 2200 UTC 2300 UTC c d The fixed-layer Significant Tornado Parameter (contour) and mixed-layer convective inhibition J/Kg (image) 15 March 2008 2000 UTC 2100 UTC 2 2 3 2 2 3 2200 UTC 2300 UTC 3 2 1 2 4 5 3 http://www.spc.noaa.gov/exper/mesoanalysis/
Craven Brooks SigSvr Parameter • The Craven Brooks SigSvr Parameter (Craven et. al. 2002) is used to discriminate between ordinary severe weather events and significant severe events (defined as hail larger than 2 inches, greater than 65 knot wind gusts and tornadoes with EF2 or greater damage). • Craven Brooks SigSvr is calculated by taking the product of 100 hPa mixed layer CAPE and the 0-6 km magnitude of the shear vector, therefore taking into account both instability and shear. Values that exceed 20,000 m3 sˉ3 associated with significant severe weather events. • Craven Brooks SigSvr values during the 2000 to 2300 UTC time period exceeded 30,000 m3sˉ3 and were as high as 55,000 m3 sˉ3 in the southern Central Savannah River Area.
2000 UTC 2100 UTC a b 2200 UTC 2300 UTC c d The Craven Brooks SigSvr parameter 15 March 2008 (contours are scaled down by 1000, 60 = 60,000 m³sˉ³). 2000 UTC 2100 UTC 20 30 20 30 40 40 50 50 2200 UTC 2300 UTC 20 20 30 40 30 50 40 http://www.spc.noaa.gov/exper/mesoanalysis/
Conclusions • Critical evaluation of the 15 March 2008 severe weather outbreak revealed the benefit of maintaining situational awareness through the utilization of NWS Storm Prediction Center’s mesoanalyses information. • In particular, the Significant Tornado Parameter and Craven Brooks SigSvr parameter can provide forecasters with important information regarding the potential of a severe weather outbreak. • These parameters are available in the Storm Prediction Center’s Short Range Ensemble Forecast (SREF) information, and can be used to identify environments which may support a significant event in the 12 to 24 hour time frame. • The Esterheld and Guiliano (2008) hodograph technique is a relatively new method by which forecasters can analyze hodographs and discriminate between the threat of weak tornadoes (EF0-EF1) and significant tornadoes (EF2+). • This technique can be applied in the operational environment during and before an expected severe weather event and may enable forecasters to better understand the potential for significant tornadic supercells.
References • Craven, J. P., H. E. Brooks, and J. A. Hart, 2002: Baseline climatology of sounding derived parameters associated with deep, moist convection. Preprints, 21st Conf. on Severe Local Storms, San Antonio, Texas, Amer. Met. Soc., 643-646. • Esterheld, J. M. and D. J. Guiliano, 2008: Discriminating between tornadic and non-tornadic supercells: A new hodograph technique. Electronic Journal of Severe Storms Meteorology 3 (2), 1 – 50. • Thompson, R.L., R. Edwards, and C.M. Mead, 2004: An update to the supercell composite and significant tornado parameters. Preprints, 22nd Conf. on Severe Local Storms, Hyannis, MA, Amer. Met. Soc. (CD ROM). • All Storm Prediction Center’s Mesoscale Severe Weather Parameters are available at http://www.spc.noaa.gov/exper/mesoanalysis. • Additional information about the 15 March 2008 event can be found at the NWS Columbia, SC, homepage – http://www.erh.noaa.gov/cae/Events/March152008/March15Severe.php