Download
1 / 57
580 likes | 594 Views
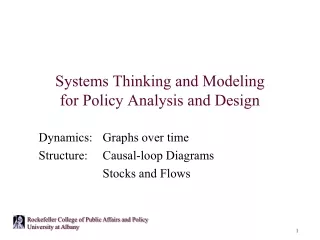
Tools for Systems Thinking and Modeling. Dynamics: Graphs over time Structure: Causal-loop Diagrams Stocks and Flows. Patterns of Behavior. System Structure. A Systems Perspective. Reactive. Events and Decisions. Adaptive. Increasing leverage. Generative. “ Distancing... ”.

E N D
Tools for Systems Thinkingand Modeling Dynamics: Graphs over time Structure: Causal-loop Diagrams Stocks and Flows
Patterns of Behavior System Structure A Systems Perspective Reactive Events and Decisions Adaptive Increasing leverage Generative
“Distancing...” A systems view stands back just far enough to... • Deliberately blur discrete events into patterns of behavior • Deliberately move from a focus on individual decisions to a focus on policy structure
Patterns of Behavior System Structure The Systems Perspective Reactive Events and Decisions Adaptive Increasing leverage Generative
Dynamics • Define problems in terms of graphs over time. • Graph important variables • Graph historical data • Graph anticipated dynamics • Graph preferred dynamics • Use these to focus systems thinking and modeling
Unemployment & Welfarein Dutchess County, NY Welfare roll Unemployment
Per Capita Residential Energy Use(USA Today 3/23/09, citing Census Bureau and U.S. Energy Information Administration)
Strive for Insights Here’s where we went wrong...
Patterns of Behavior System Structure The Systems Perspective Reactive Events and Decisions Adaptive Increasing leverage Generative
Systems Structure • Accumulations (populations, resources…) • Causal structure: “feedback” loops • Delays • Perceptions (a kind of accumulation) • Pressures • Affects, emotions, (ir)rationalities • Policies governing decisions
Causal Loop Diagrams • Causal mapping is a powerful tool for representing structure in complex systems. • Arrows indicate causal influence.
Polarities of Causal Links • Positive and negative signs show the direction of causality: + – – + + ... “direct” relation – …“inverse” relation + –
Definitions of Link Polarities A adds to B, or ∆A leads to ∆B in the same direction C subtracts from D, or ∆C leads to ∆D in the opposite direction All words phrases are expressed as quantities that have a clear sense of increase or decrease. No verbs — the action is in the arrows.
An increase in A makes B higher than it would have been without the change. An increase in C makes D lower than it would have been without the change. Simple test for link polarity
Examples More lawyers mean more litigation; fewer lawyers, less litigation + Emigration subtracts from population: An increase in emigration means less (a decrease means more) than we’d have without the change – “Ceteris paribus”... All other influences held constant as we assign polarities.
d Exercises
A feedback loop exists when decisions change the state of the system, changing the conditions and information that influence future decisions. Feedback Loops
Reinforcing loops Growth producing Destabilizing Accelerating Positive: an even number of –’s Symbolized by Balancing loops Counteracting Goal seeking Stabilizing Negative: an odd number of –’s Symbolized by Two kinds of feedback loops
Examples of Reinforcing Loops + + + + + + + – –
Isolate and Identify Link Polarity(Always trace an Increase) +
Isolate and Identify Link Polarity(Always trace an Increase) +
Isolate and Identify Link Polarity(Always trace an Increase) –
Isolate and Identify Link Polarity(Always trace an Increase) –
Isolate and Identify Link Polarity(Always trace an Increase) +
Completed Loop(Now tell the story) + + + (R) – –
20,000 15,000 10,000 10,000 5,000 9,000 0 0 25 50 75 100 8,000 7,000 6,000 0 25 50 75 100 Typical Reinforcing Loop Behaviors Population and Births Loop Businesses and Taxes Loop
World Population (billions) 8 6 4 2 0 1500 1600 1700 1800 1900 2000
Reinforcing Feedback in the Newspaper Garfield’s happiness Jon’s suspicion (R)
Examples of Balancing or Counteracting Loops + – + - + + – – + +
Filling a Glass 10,000 20 7,500 15 5,000 10 2,500 5 • 0 • 7.5 • 15 • 22.5 • 30 0 0 0 0 25 10 50 20 75 30 100 40 Population and emigration Typical Counteracting Loop Behaviors Predator-prey interactions
Tips for Determining Link and Loop Polarities • For each link, determine the effect of an increase in the variable at the tail of the arrow: • If the variable at the head increases, assign a plus. • If the variable at the head decreases, assign a minus. • For each loop, count the number of negative signs: • An even number of negative links is a reinforcing (R) loop. • An odd number of negative links is a balancing (B) loop. • Most important: For each loop, tell a self-reinforcing or balancing/counteracting story, and check that the story matches the loop polarity.
More Serious Example from the Newspaper:Recall the graph of per capita energy use
Clarity of presentation Clarifying Audience questions understanding Presentation Dynamics
Stocks and Flows Stocks are accumulations. • Stocks are increased by inflows and decreased by outflows. • When a link means “add” or “subtract” we have a stock-and-flow structure. • Example: Inventory
A Stock and Flow Example Explicit stocks and flows: The corresponding causal-loop diagram:
Human Activity, CO2, and Global Temperature Thought experiment:
Structure and Dynamics of Terrorist Cells Peripheral support Funding (R) Suppression activities Terrorist actions (R) (R) (B) (R) New recruits Terrorist group (R) Losses (B) Zeal (R) (R) Martyrs to the cause