Download
1 / 35
380 likes | 564 Views
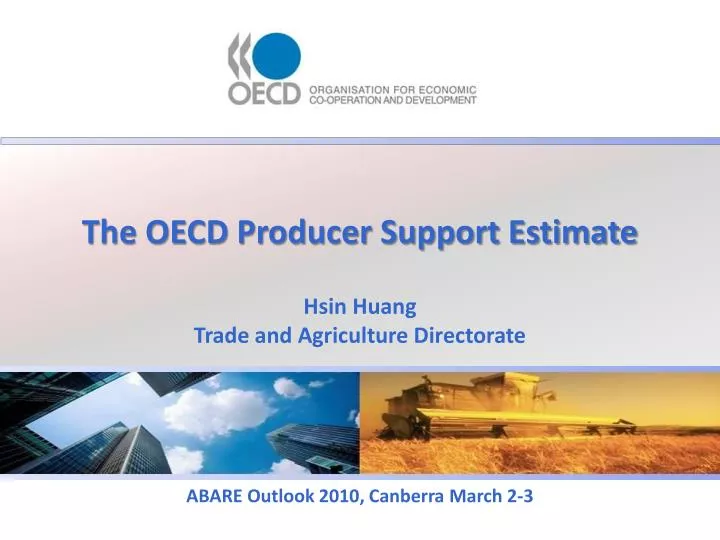
The OECD Producer Support Estimate. Hsin Huang Trade and Agriculture Directorate. ABARE Outlook 2010, Canberra March 2-3. Background. How did OECD get involved?. Crisis in international agricultural trade in late 1970s and early 1980s...

E N D
The OECD Producer Support Estimate Hsin Huang Trade and Agriculture Directorate ABARE Outlook 2010, Canberra March 2-3
How did OECD get involved? • Crisis in international agricultural trade in late 1970s and early 1980s... • …although beggar my neighbour policies were costly there was no incentive for unilateral action… • …yet no agreed way to measure, compare and evaluate the trade effects of support
What was OECD asked to do? • In 1982 OECD was given a mandate by OECD meeting of Finance and Trade ministers… • “…to analyse the approaches and methods for a balanced and gradual reduction of protection for agriculture and the fuller integration of agriculture within the open multilateral trading system”
How did the OECD respond? • Adopted the Producer Subsidy Equivalent (PSE), which became the Producer Support Estimate in 1998 • Results in 1987 led to the OECD Ministerial principles for agricultural policy reform • Key principle was to allow market signals to influence the orientation of production, by way of a reduction in agricultural support
What is the PSE? • The Producer Support Estimate is an indicator of the annual monetary value of gross transfers to FARMERS • Measured at the farm gate • Irrespective of objective or impact on farm production or income or the environment • Mix of economics + bean-counting
What is the PSE? ECONOMIC MEASURE OF TRANSFER • Market Price Support: policies maintain domestic market prices for farm goods above those at the border (e.g. tariffs, quota) PAYMENTS TO FARMERS • Budget Transfers: program payments AND budget revenue foregone (e.g. fuel tax credits)
Which policies are considered? • Policies for which support calculations are made: • those that generate transfers to producers from consumers or taxpayers – opportunity cost • general economy-wide policies not considered, even if they generate transfers to producers • calculations based on how policies are implemented, not policy objectives or impacts • assumption of competitive markets
Where does the information come from? • National governments • Annual questionnaire to OECD members (and some non-members) • Through delegations • Public/published sources • OECD Secretariat works in cooperation with respective countries to classify the information and produce the calculations
PSE: classification of policies • It is important for policy evaluation to know “how” support is provided • Support delivered in different ways can have different effects on production, trade, farm income, environment… • PSE classification distinguishes different ways to deliver support • “decoupling of support” is a key consideration • more attention now to “non-production” concerns
PSE classification Production required A. Support based on commodity output Output B. Payments based on input use Inputs C. Payments based on A/An/R/I Production required Current A/An/R/I Factors and income Area (A) Animals (An) Receipts (R) Income (I) D. Payments based on A/An/R/I Non-current A/An/R/I Production required Production not required E. Payments based on A/An/R/I Production not required Non-current A/An/R/I Non-commodity criteria F. Payments based on non-commodity criteria G. Miscellaneous payments
PSE classification Current parameters A. Support based on commodity output Output B. Payments based on input use Inputs C. Payments based on A/An/R/I Production required Current A/An/R/I Factors and income Area (A) Animals (An) Receipts (R) Income (I) Non-current parameters D. Payments based on A/An/R/I Non-current A/An/R/I Production required E. Payments based on A/An/R/I Production not required Non-current A/An/R/I Non-commodity criteria F. Payments based on non-commodity criteria G. Miscellaneous payments
PSE Classification: support indicators PSE classification also tells whether support: • involves limits on production/payments or not • is provided with variable/fixed payment rates • imposes any kinds of input constraints or not • is given to a single commodity only, group of commodities, or all commodities • is for non-commodity production
Reminder: why develop support indicators? Support indicators were developed to: 1. monitor and evaluate developments in agricultural policies 2. establish a common base for policy dialogue within and among countries 3. provide input into trade negotiations 4. provide data for analysis of policy impacts
Support differs widely (Producer Support Estimates as a percent of gross farm receipts) EU OECD USA Australia
Evolution ofpoliciesreflected in PSE • As share of market price support falls, payments become more important • New forms of decoupled payments were introduced… • …some of which did not easily fit into previous PSE categories • …and more payment categories needed to accommodate these policies, leading to overhaul of PSE in 2007
Market Price Support and Budgetary Transfers2004-06 average %PSE is in brackets OECD, PSE/CSE database
Composition of PSE: policy categories OECD, PSE/CSE database
1. Monitoring and evaluation • A unique source of reference • Monitoring and evaluation of agricultural policies in OECD countries, annually since 1988 • Monitoring and evaluation of policies in non-OECD countries, bi-annually • Reviews of agricultural policies undertaken before they appear in the regular M+E reports
2. Policy dialogue • Evidence-based exchange of views • PSEs are calculated using a common methodology and set of practices • PSEs comprehensively measure support to farmers • PSEs enable OECD countries, farmer organisations, and NGOs to focus on the reasons for varied progress in reform and future policy directions • PSEs are the established international benchmark
3. Trade negotiations • Supporting the WTO multilateral negotiations • The OECD methodology developed in the early 1980s was the conceptual basis for the Aggregate Measure of Support in the GATT Uruguay Round • The PSE and AMS have different aims, but they are complementary
4. Analytical studies • Rich database for modelling impacts of policies • PSEs are accounting tools – they do not as such measure impacts of policies • But PSE data can be used in models to assess impacts of policy change on incomes, production, trade (PEM, GTAP) • …as well as transfer efficiency of policies – the share of policy support that goes to farmers • PSE data base available to research community
Concluding remarks • PSE represents a comprehensive and unique account of policy transfers • PSE does NOT measure policy impacts but are a key input into policy analysis • PSE database is a rich source of transparent policy information, internationally comparable and updated
Thank You Trade and Agriculture Directorate Visit our website: www.oecd.org/agriculture Support indicators (PSE/CSE) database: www.oecd.org/tad/support/psecse Contact: hsin.huang@oecd.org