Download
1 / 47
480 likes | 606 Views
Geographic Information Systems : Data Types, Sources and the ArcView Program. Overview. Lecture (50 min) Review Spatial Data Shapefiles, Images, Grids, TINs Relational Databases Links and Joins What is ArcView Scale and Resolution Break (15 min) ArcView Intro Lab (75 minutes)

E N D
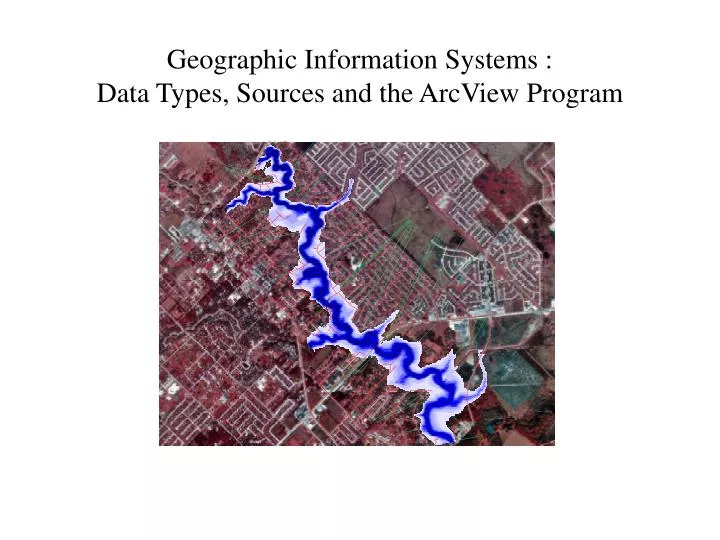
Geographic Information Systems :Data Types, Sources and the ArcView Program
Overview • Lecture (50 min) • Review • Spatial Data • Shapefiles, Images, Grids, TINs • Relational Databases • Links and Joins • What is ArcView • Scale and Resolution • Break (15 min) • ArcView Intro Lab (75 minutes) • Homework Assignment
GIS: Simplified (Review) • A computer-based tool for mapping and analyzing things. • Geospatial Database: a set of compatible data layers or themes
Digital Hydrologic / Hydraulic Processing (Review) HEC-RAS Water surface profiles HEC-HMS Flow discharge HEC-GeoHMS HEC-GeoRAS ArcView Digital Elevation Model ArcView Flood plain maps Digital Map Database
GIS: Analysis (Review) • Why should spatial data be stored in a GIS? • Want to use the power of the computer to ask queries of the spatial data • Analyze data and produce new information • Convey technical data non-technically
GIS Data Types Discrete Space: Vector Data -- Shapefiles Continuous Space: Raster Data -- Grids -- TINs (Triangulated Irregular Networks) -- Images
Vector Data: Types Vector data are defined spatially as either: (x1,y1) Point - a pair of x and y coordinates vertex Line - a sequence of points Node Polygon - a closed set of lines
Sample Point Shapfile: Water Right Locations A “point” shapefile Each data point has a specific x,y coordinate pair
Sample Line Shapefile: River Reaches Each “line” consists of two nodes and a series of vertices
Sample Polygon Shapefile: River Basins A closed set of lines illustrating the watershed or drainage area for a corresponding river reach
Cell size Number of rows NODATA cell (X,Y) Number of Columns Spatial Data: Grid (Raster)format Raster data are described by a cell grid, one value per cell:
NEXRAD Rainfall Intensity Image October 18, 1994 @ 3:00 AM (CST)
NEXRAD Rainfall Intensity Image October 18, 1994 @ 4:00 AM (CST)
Raster and Vector Data Vector Raster Point Line Zone of cells Polygon
Image Data and Vector Overlays • Image data is nothing more than a properly placed picture. Actually made of pixels of a certain cell size much like raster data. • Smaller the cell size – the more refined the resolution – the sharper the picture • Vector representations are often traced from a “base” image map Reservoir and Highway
Image Data and Raster Overlays • Samples attributes at fixed intervals • List of numbers, one number per cell Reservoir and Highway
Triangulated Irregular Network(TIN) Outside Channel: Raster DEM Inside Channel: Vector cross-sections Triangular mesh of (x,y,z) points Triangles as elements Result: TIN of channel and landscape
Three-Dimensional View of a TIN (Clear Creek and Cowarts Creek Confluence)
Hydrologic Cycle Atmospheric water Surface water Subsurface water Connecting processes in the hydrologic cycle involves linking spatial features of various kinds
Section Summary • Four types of GIS data: • Shapefiles (point, line, polygon) • Grids • TINs • Images • A real-world region can be considered spatially discrete or spatially continuous • Discrete space is represented by features in vector data(shapefiles) and continuous space by elements or cells inraster data (grids) • Both vector and raster data are required to represent the real-world in the digital GIS world Raster-Vector model
Overview • Lecture (45 min) • Review • Spatial Data • Shapefiles, Images, Grids, TINs • Relational Databases • Links and Joins • What is ArcView • Scale and Resolution • Break (15 min) • ArcView Intro Lab (75 minutes) • Homework Assignment
GIS: Data Entry and Storage • Store data in a logical way • Maps and data are stored in digital form • Digital layers with attributes attached • Layers are stored together in a relational database using a database management system (DBMS).
Attributes • GIS stores more than just maps • Relationship between map features and attributes within a GIS • Dynamic interactive maps
DBMS Database Management System • Inside the DBMS, spatial data is stored as digital layers with their associated attributes
Levels of Analysis:Relational Database Relational Linkages Spatial Attributes Water Right Locations Descriptive Attributes
Feature Attribute Table (Vectors) Fields Records
Value Attribute Table (Grids) Attributes of grid zones
Query Builder - find all countries with pop > 1 million people
Edit Join Link Tables: Edit, Join and Link
Relationships in Linking and Joining Tables Source Table (new information to be added) Destination Table (existing information) Many to one relation Primary Key field (each record must have a unique value) Relate field (can have one or many records for each value)
Concept Summary • All GIS data files have descriptive attributes in a data table associated with each file • Feature attributes (associated with vector files) form the basis for data analysis of these files • Value attributes (associated with grid files) form the basis for continuous representation of data across a surface (precipitation, elevation, etc) • Attribute tables can be linked or joined to related tables using a key field
What is ArcView? • Desktop geographic information system (GIS) from ESRI • Uses scripting language called Avenue • Customize GUI • April 20, 2002 – ArcGIS released
Overview • Lecture (45 min) • Review • Spatial Data • Shapefiles, Images, Grids, TINs • Relational Databases • Links and Joins • What is ArcView • Scale and Resolution • Break (15 min) • ArcView Intro Lab (75 minutes) • Homework Assignment
Soil Map of TNRCC Management Segment 841 Lower West Fork Trinity River
30 m DEM of Lower West Fork, Trinity River Both regions and features can be represented using elements