Download
1 / 1
10 likes | 110 Views
Evaluation of Hyperspectral Infrared Soundings in Tropical Cyclone Environments Mark DeMaria 1 , Donald W. Hillger 1 , Chris D. Barnett 2 , Jason P. Dunion 3 , Robert T. DeMaria 4 1 NESDIS/ORA-STAR, Fort Collins, CO; 2 NESDIS/ORA-STAR, Camp Springs, MD,

E N D
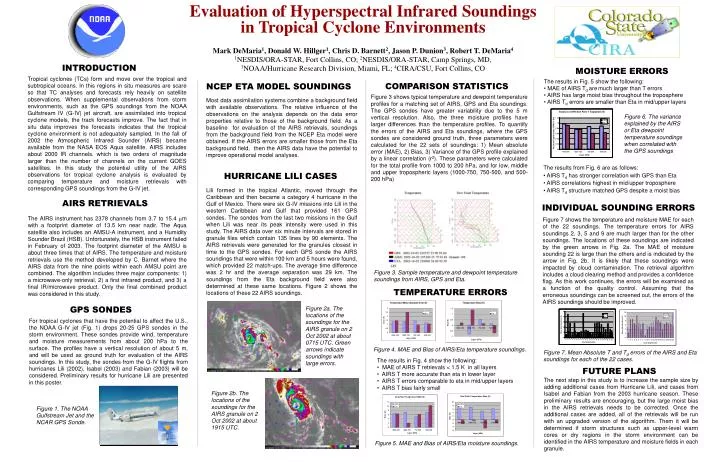
Evaluation of Hyperspectral Infrared Soundings in Tropical Cyclone Environments Mark DeMaria1, Donald W. Hillger1, Chris D. Barnett2, Jason P. Dunion3, Robert T. DeMaria4 1NESDIS/ORA-STAR, Fort Collins, CO; 2NESDIS/ORA-STAR, Camp Springs, MD, 3NOAA/Hurricane Research Division, Miami, FL; 4CIRA/CSU, Fort Collins, CO INTRODUCTION MOISTURE ERRORS Tropical cyclones (TCs) form and move over the tropical and subtropical oceans. In this regions in situ measures are scare so that TC analyses and forecasts rely heavily on satellite observations. When supplemental observations from storm environments, such as the GPS soundings from the NOAA Gulfstream IV (G-IV) jet aircraft, are assimilated into tropical cyclone models, the track forecasts improve. The fact that in situ data improves the forecasts indicates that the tropical cyclone environment is not adequately sampled. In the fall of 2002 the Atmospheric Infrared Sounder (AIRS) became available from the NASA EOS Aqua satellite. AIRS includes about 2000 IR channels, which is two orders of magnitude larger than the number of channels on the current GOES satellites. In this study the potential utility of the AIRS observations for tropical cyclone analysis is evaluated by comparing temperature and moisture retrievals with corresponding GPS soundings from the G-IV jet. • The results in Fig. 5 show the following: • MAE of AIRS Td aremuch larger than T errors • AIRS has large moist bias throughout the troposphere • AIRS Td errors are smaller than Eta in mid/upper layers COMPARISON STATISTICS NCEP ETA MODEL SOUNDINGS Figure 3 shows typical temperature and dewpoint temperature profiles for a matching set of AIRS, GPS and Eta soundings. The GPS sondes have greater variability due to the 5 m vertical resolution. Also, the three moisture profiles have larger differences than the temperature profiles. To quantify the errors of the AIRS and Eta soundings, where the GPS sondes are considered ground truth, three parameters were calculated for the 22 sets of soundings: 1) Mean absolute error (MAE), 2) Bias, 3) Variance of the GPS profile explained by a linear correlation (r2). These parameters were calculated for the total profile from 1000 to 200 hPa, and for low, middle and upper tropospheric layers (1000-750, 750-500, and 500-200 hPa) Most data assimilation systems combine a background field with available observations. The relative influence of the observations on the analysis depends on the data error properties relative to those of the background field. As a baseline for evaluation of the AIRS retrievals, soundings from the background field from the NCEP Eta model were obtained. If the AIRS errors are smaller those from the Eta background field, then the AIRS data have the potential to improve operational model analyses. Figure 6. The variance explained by the AIRS or Eta dewpoint temperature soundings when correlated with the GPS soundings • The results from Fig. 6 are as follows: • AIRS Td has stronger correlation with GPS than Eta • AIRS correlations highest in mid/upper troposphere • AIRS Td structure matched GPS despite a moist bias HURRICANE LILI CASES Lili formed in the tropical Atlantic, moved through the Caribbean and then became a category 4 hurricane in the Gulf of Mexico. There were six G-IV missions into Lili in the western Caribbean and Gulf that provided 161 GPS sondes. The sondes from the last two missions in the Gulf when Lili was near its peak intensity were used in this study. The AIRS data over six minute intervals are stored in granule files which contain 135 lines by 90 elements. The AIRS retrievals were generated for the granules closest in time to the GPS sondes. For each GPS sonde the AIRS soundings that were within 100 km and 5 hours were found, which provided 22 match-ups. The average time difference was 2 hr and the average separation was 29 km. The soundings from the Eta background field were also determined at these same locations. Figure 2 shows the locations of these 22 AIRS soundings. AIRS RETRIEVALS INDIVIDUAL SOUNDING ERRORS The AIRS instrument has 2378 channels from 3.7 to 15.4 m with a footprint diameter of 13.5 km near nadir. The Aqua satellite also includes an AMSU-A instrument, and a Humidity Sounder Brazil (HSB). Unfortunately, the HSB instrument failed in February of 2003. The footprint diameter of the AMSU is about three times that of AIRS. The temperature and moisture retrievals use the method developed by C. Barnet where the AIRS data from the nine points within each AMSU point are combined. The algorithm includes three major components: 1) a microwave-only retrieval, 2) a first infrared product, and 3) a final IR/microwave product. Only the final combined product was considered in this study. Figure 7 shows the temperature and moisture MAE for each of the 22 soundings. The temperature errors for AIRS soundings 2, 3, 5 and 9 are much larger than for the other soundings. The locations of these soundings are indicated by the green arrows in Fig. 2a. The MAE of moisture sounding 22 is large than the others and is indicated by the arrow in Fig. 2b. It is likely that these soundings were impacted by cloud contamination. The retrieval algorithm includes a cloud clearing method and provides a confidence flag. As this work continues, the errors will be examined as a function of the quality control. Assuming that the erroneous soundings can be screened out, the errors of the AIRS soundings should be improved. Figure 3. Sample temperature and dewpoint temperature soundings from AIRS, GPS and Eta. TEMPERATURE ERRORS GPS SONDES Figure 2a. The locations of the soundings for the AIRS granule on 2 Oct 2002 at about 0715 UTC. Green arrows indicate soundings with large errors. For tropical cyclones that have the potential to affect the U.S., the NOAA G-IV jet (Fig. 1) drops 20-25 GPS sondes in the storm environment. These sondes provide wind, temperature and moisture measurements from about 200 hPa to the surface. The profiles have a vertical resolution of about 5 m, and will be used as ground truth for evaluation of the AIRS soundings. In this study, the sondes from the G-IV flights from hurricanes Lili (2002), Isabel (2003) and Fabian (2003) will be considered. Preliminary results for hurricane Lili are presented in this poster. Figure 4. MAE and Bias of AIRS/Eta temperature soundings. Figure 7. Mean Absolute T and Td errors of the AIRS and Eta soundings for each of the 22 cases. • The results in Fig. 4 show the following: • MAE of AIRS T retrievals < 1.5 K in all layers • AIRS T more accurate than eta in lower layer • AIRS T errors comparable to eta in mid/upper layers • AIRS T bias fairly small FUTURE PLANS The next step in this study is to increase the sample size by adding additional cases from Hurricane Lili, and cases from Isabel and Fabian from the 2003 hurricane season. These preliminary results are encouraging, but the large moist bias in the AIRS retrievals needs to be corrected. Once the additional cases are added, all of the retrievals will be run with an upgraded version of the algorithm. Them it will be determined if storm structures such as upper-level warm cores or dry regions in the storm environment can be identified in the AIRS temperature and moisture fields in each granule. Figure 2b. The locations of the soundings for the AIRS granule on 2 Oct 2002 at about 1915 UTC. Figure 1. The NOAA Gulfstream Jet and the NCAR GPS Sonde. Figure 5. MAE and Bias of AIRS/Eta moisture soundings.