Download
1 / 18
180 likes | 185 Views
The Virtual Exploratorium is a learner-centered, scientific exploratory environment that combines advances in computing, new pedagogy, and the tools and practice of scientists. This project focuses on using the Virtual Exploratorium to support inquiry-based learning in introductory geoscience courses, with an example related to El Niño/Southern Oscillation (ENSO). The project aims to develop a pedagogic model, conduct formative evaluations with students, and research student visualization and inquiry processes. This initiative is funded by the National Science Foundation, Division of Undergraduate Education.

E N D
Using the Virtual Exploratorium to Support Inquiry-based Learning in Introductory Geoscience Courses: An ENSO Example Funded by National Science Foundation, Division of Undergraduate Education
The Virtual Exploratorium • A learner-centered scientific exploratory environment using the visualization tools of practicing scientists • Combines: • advances in computing • new pedagogy • tools and practice of scientists
A Diverse Team • University of Illinois at Urbana-Champaign, Department of Atmospheric Science: • Dan Bramer, Mohan Ramamurthy and Robert Wilhelmson • Digital Library for Earth Science Education • Mary R. Marlino • Visualization Group, Scientific Computing Division, National Center for Atmospheric Research • Tim Scheitlin, Don Middleton • University of Georgia,Learning and Performance Support Laboratory • Ken Hay and Dean Elliott • West Chester University, Department of Geology and Astronomy • Rajul Pandya
The Virtual Exploratorium • An initial module built around the phenomenon of El Niño/Southern Oscillation • development guided by: • A pedagogic model for Geoscience Education • Formative evaluation with students • Research into student visualization and inquiry processes
Why ENSO? • Encourages Inquiry and Learning • Popular and relevant • Lots of misconceptions/misinformation • Bridges Geoscience Disciplines • Depends on fundamental physical principles applicable across the geosciences • Allows a systems-oriented approach • Data intensive, visualization rich phenomenon benefits from scientific tools
Why Relation to the underlying physical principles that “explain” the behavior of the natural world A Pedagogic Model for the VE What A description of the phenomena, including conceptualization of the complex
probe these visualizations to uncover relationships using interactive tools investigate fundamental physical processes using the same tools in tutorials apply the physical principles to the phenomena Tools and a Strategy for Investigation construct visualizations of geophysical phenomena using real geophysical data sets Visualization Environment and Data Sets Interactive Tools Tool Tutorials consult an extensive, hyper-linked virtual encyclopedia
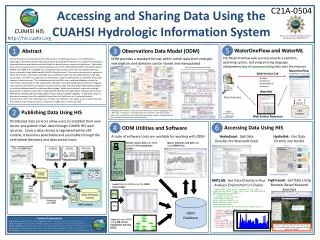
Prototype Visualization Environment • Students Can • Choose a data set • Construct 3D iso-surfaces and 2D slices • View multiple variables simultaneously • Save images • Students will be able to • Use Java-based tools as probes within the visualization
An ENSO Data Sets for Students Complex Data from multiple sources reduced through filters for student users
Basic Research • Can students discover and interpret geophysical phenomena? • Investigated three geophysical phenomena associated with ENSO • Walker Circulation • Convection in a thunderstorm • Upwelling and motion of the thermocline • Investigated students ability to find phenomena with varying levels of intervention
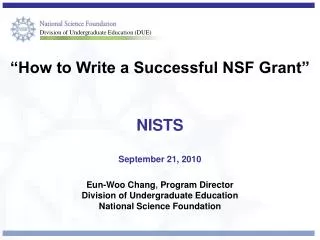
A student Constructed Visualization (Walker Cell) Very few students can find and explain the Walker Cell using the Visualization Environment and Data Sets
Obstacles to Inquiry • lack of strategy for systematic investigations • Student’s resent a perceived lack of support - “the professor was no help at all” • Unfamiliarity with Multi-dimensional visualization • bias to temperature • bias to 2D • 20-40 minute learning curve
A Strategy: Guided Inquiry • Core Questions: the overarching goal of the inquiry • Why are storms so common in the western Pacific? • Uses Visualization and Data Sets • Guiding Questions: help focus students on the things that they need to notice • How does temperature in the rising part of the circulation compare to temperature in the sinking part? • Uses Interactive Tools as probes • Enrichment Questions: help students focus on fundamental physics • What is Temperature • Uses Interactive Tools in Tutorials
Interactive Tools as Probes • Probe 2D or 3D datasets • Observe differences between regions of the dataset • Relate phenomena to the underlying physical properties
Interactive Tools as Tutorials Students use the tool to: • Help understand the fundamental principles which lay underneath the phenomena • Create graphs of their observations • Use these observations to discover new relationships
For More Information http://ve.atmos.uiuc.edu/
A Unique Opportunity • Community interest in educational isssues • New pedagogy • Technological advances • tools of science available to students
Three levels of interventions Inquiry • Pure Discovery: student explores data set with no introduction to the phenomenon in question. • Application: Student is given a conceptual introduction to the phenomenon, but must apply the phenomenon to the data set. • Verification: Student is given a complete introduction to phenomenon and information about its location, extent, and timing. Instruction