Download
1 / 50
500 likes | 620 Views
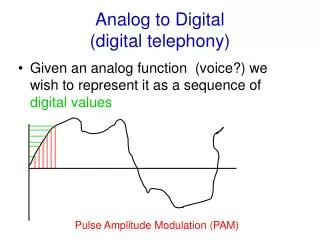
From Analog to Digital. What are Digital Images?. Electronic snapshots taken of a scene or scanned from documents samples and mapped as a grid of dots or picture elements (pixels) pixel assigned a tonal value (black, white, grays, colors), represented in binary code

E N D
What are Digital Images? • Electronic snapshots taken of a scene or scanned from documents • samples and mapped as a grid of dots or picture elements (pixels) • pixel assigned a tonal value (black, white, grays, colors), represented in binary code • code stored or reduced (compressed) • read and interpreted to create analog version
CUL Bias on Image Capture: • Create rich images that are useful over time in the most cost-effective manner. • Set conversion requirements greater than immediate application • Promote reuse of content • Enable sharing of comparable and trusted resources across disciplines, users, and institutions
Why Rich Digital Masters? • Preservation • Original may only withstand one scan • Maintenance of digital files • Cost • One scan may be all that is affordable • Conversion costs dwarfed by other costs • Access • Many from one • The richer the file, the better the derivative in terms of quality and processibility
How to determine what’s good enough? • Connoisseurship of document attributes • Identify key information content • Objectively characterize or measure attributes: size, detail, tone, and color • Appreciate imaging factors affecting quality and cost • Translate between analog and digital • Equate measurements to digital equivalencies and corresponding metrics, e.g., detail size resolution MTF
CUL’s Approach to Imaging: “No More, No Less” desired point of capture image quality and utility Image requirements and cost
Digital Image Quality is Governed By: • resolution and threshold • bit depth • color management • image enhancement • compression and file format • system performance
Resolution • Determined by number of pixels used to represent the image • Increasing resolution increases level of detail captured and geometrically increases file size zoom in
Effects of Resolution 600 dpi 300 dpi 200 dpi
Threshold Setting in Bitonal Scanning defines the point on a scale from 0 to 255 at which gray values will be interpreted either as black or white
Effects of Threshold threshold = 60 threshold = 100
Bit Depth • Determined by the number of binary digits (bits) used to represent each pixel 8-bit 24-bit 1-bit
Bit Depth • increasing bit depth increases the level of gray or color information that can be represented and arithmetically increases file size • Bit depth, dynamic range, and color appearance
Utilizing Sufficient Bit-Depth 3-bit gray 8-bit gray
Utilizing Sufficient Bit Depth 8-bit color 24-bit color
Bit Depth vs. Dynamic Range • The range of tonal difference between lightest light and the darkest dark
Representing Color Appearance Color Shift Towards Red Balanced Color
Image Enhancement • Image editing to modify or improve an image • filters (brightness, contrast, sharpness, blur) • tone and color correction • Use raises concerns about fidelity and authenticity
Effects of Filters no filters used maximum enhancement
Compression • reduces file size for processing, storage, transmission, and display • image quality may be affected by the compression techniques used and the level of compression applied
Compression Variables • lossless versus lossy compression • proprietary vs. open schemes • level of industry support • bitonal vs. gray/color • see attributes of common compression techniques at: www.library.cornell.edu/preservation/tutorial/presentation/table7-3.html
Effects of JPEG Compression 300 dpi, 8-bit grayscale uncompressed TIFF JPEG 18.5:1 compression
Compression /File Format Comparison GIF (lossless) File Size: 60 KB JPEG (lossy) File Size: 49 KB images courtesy of Edison Papers
File Formats • Consist of both the bits that comprise image information and header information on how to read and interpret the file • Image quality affected by format support for: • Bit depth • Compression techniques • Color management • Hardware,software, and network support • See common file formats chart at: www.library.cornell.edu/preservation/tutorial/presentation/table7-1.html
Equipment used and its performance over time • scanners with same stated functionality can produce different results • Factors affecting image quality: • Optical, mechanical, and sensing components • Calibration • Age of equipment • Environment
Variations in Image Quality due to Scanner Performance 300 dpi, scanner A 300 dpi, scanner B
Correlating Document Attributes to Image Requirements • Example: Determining Resolution Requirements • What’s you finest feature? • What’s your quality requirement? • What’s your imaging approach?
Case Study: Brittle Books • Variables: feature size, quality, imaging approach • fixed metric: smallest lower case letter • QI values: 8(excellent), 5 (good), 3.6 (marginal) • Resolution key to text capture, e.g., dpi • Bitonal QI formula for text • DPI = 3QI/.039h • 600 dpi 1-bit capture adequately preserves informational content of cleanly produced text and supports image processing (e.g., OCR)
Textual Documents May Require Tonal Capture • Pages badly stained • Pages exhibit low contrast between text and background • Fine features not fully resolved • Pages contain complex graphics, color or important contextual information • Gray/color QI formula for text • Dpi = 2QI/.039h
Determining Resolution Requirements beyond Text • Stroke width • Finest scale • Visual perception
Defining Detail as Stroke • Edge-based representations • Variables: feature size, quality, imaging approach • fixed metric: width of finest line, stroke, dot, or marking • QI values based on sampling frequency: 2(excellent), 1.5 (good), 1(marginal) • Resolution and bit depth key to quality
Defining Detail as Stroke • QI formulas for stroke • Gray/color: dpi = QI/.039w QI = dpi x .039w • Bitonal: dpi = (1.5QI)/.039w
Example • Manuscript page with finest significant stroke measuring .2mm, which must be fully captured • Gray/color: dpi = QI/.039w • QI=2, w=.2 • Dpi = 2/[.039(.2)] = 256 dpi
Defining Detail as Scale • Smallest significant scale or repeatable pattern, e.g., knots in a rug vs. strands in the thread • Can result in very high resolution requirements (e.g., photographs, book illustrations) • Halftones: scan at 4 times the screen ruling, utilize special descreen/rescreening, or scan in grayscale (400 dpi is a good default)
Defining Detail Based on Visual Perception • Human eye can detect details approximately 1/215 inch wide • Finer details are optically averaged • Using two pixel rule, visual perception requirements met at 430 dpi • Illustrated Book Study: 400 dpi grayscale recommendation
Translating Between Digital Resolution and Scanner Performance • Detail capture governed by resolution, threshold, bit-depth, and system performance • Sampling resolution (DPI) is not a true indicator of image quality, although it may suffice for scanning in the 300-600 dpi range • Monitor Emerging System Performance Metrics (e.g., MTF)
Aligning Document Attributes with Digital Requirements • Identify key document attributes • Tone, color, and detail • Characterize them, if possible through objective measurements • Determine quality requirements and tolerance levels • Translate between analog and digital and between scanning requirements and scanning performance
Aligning Document Attributes with Digital Requirements • Calibrate scanner with targets and software • Calibrate the rest of the system • Control lighting and environment • Scan appropriate targets with documents • Evaluate images against originals
Aligning Document Attributes with Digital Requirements • Minimize post-processing in the master image • Save in TIFF; avoid lossy compression • Maintain scanning metadata • Monitor emerging image quality metrics
One Size Does Not Fit All! • Different document types will require different scanning equipment and processes • The more complex the document, the higher the conversion/access requirements • Scan the original whenever possible • No standards for image conversion: guidance rather than guidelines • Notion of long-term utility and cross-institutional resources gaining ground