Download
1 / 35
350 likes | 517 Views
Finding Unusual Correlation Using Matrix Decompositions. David Skillicorn School of Computing, Queen’s University Math and CS, Royal Military College skill@cs.queensu.ca. The problem: Detect the footprint of terrorist presence/action in large datasets. The solution:

E N D
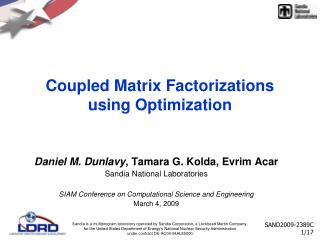
Finding Unusual Correlation UsingMatrix Decompositions David Skillicorn School of Computing, Queen’s University Math and CS, Royal Military College skill@cs.queensu.ca
The problem: Detect the footprint of terrorist presence/action in large datasets. The solution: Look for differences between the correlative structure of terrorist group and other kinds of groups. The technique: Use matrix decompositions, particularly singular value decomposition and semidiscrete decomposition. Why it’s interesting: These techniques are good at detecting clusters, even when hidden inside other clusters.
Background: There are many datasets that contain data that might reveal the existence and actions of terrorist groups: Echelon signal traffic, airline travel records, financial records, CCTV surveillance (e.g. London central traffic). There are ongoing issues around collection and access to such data (Taipale). Societal attitudes are not very consistent: collecting airline travel records is offensive, but Echelon is apparently not. The goal is not classification (these objects are OK, these objects are suspicious) but rather ranking – for further downstream analysis. At this early stage, false negatives are more of a problem than false positives.
Broadly, there are 3 analysis strategies: 1. Consider each object (a person, a message) individually and decide whether or not it is suspicious. This assumes that there are attributes that, by themselves, are enough to cause suspicion (e.g. CAPSS II “rooted in the community”). Countermeasures: make sure that measured attribute values are innocuous (probing); take on someone else’s attribute values (identity theft). In general, each object tries to hide in the noise by looking like every other object.
2. Look for sets of objects that are connected based on some of their attributes. Link Analysis, Social Network Analysis – “connecting the dots”. Criminal groups have different structure: unusually connected to each other. Terrorist groups are like this too, but also less connected to society at large. Countermeasures: conceal the connections between the objects by making sure they share no obvious attribute values: * decouple by using intermediaries * smear time factors e.g. by using web sites, message drops In general, a group tries to hide in the noise by looking like all the other groups, or not like a group at all.
3. Look for sets of objects that are connected in more subtle ways because of correlation among their properties. Workable countermeasures are hard to find because: * a group acts with a common purpose which creates commonalities in attribute values (but NOT necessarily equalities) * a group has a target and so is forced to acquire attribute values that have commonalities with the target Furthermore, an ordinary group tends to have highly varied correlation with other groups, and so seems much more diffuse. This approach recognizes the structures visible to link analysis, but can see other connections as well.
We consider artificial datasets of three kinds: 1. Gaussian distributed data to represent attributes such as locations, ages, etc. 2. Poisson distributed data to represent attributes such as actions during a specific time period (e.g. travel to a particular city in a particular week) 3. Sparse data, because many forms of data (e.g. travel, word usage) are naturally sparse
In this talk: 1000 rows, normally distributed in 30 dimensions (representing dense attribute data). 10 extra rows normally distributed, in each dimension, around a random row of the base dataset. This models correlation of the terrorist cell with a target. This does not reduce the generality of the model, since omitting the target row makes a very small change in the resulting models.
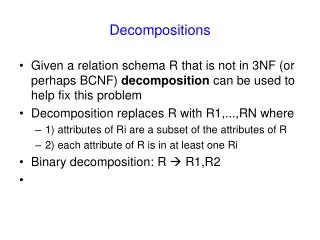
Matrix decompositions. The basic idea: * Treat the dataset as a matrix, A, with n rows and m columns; * Factor A into the product of two matrices, C and F A = C F where C is n x r, F is r x m and r is smaller than m. Think of F as a set of underlying `real’ somethings and C as a way of `mixing’ these somethings together to get the observed attribute values. Choosing r smaller than m forces the decomposition to somehow represent the data more compactly. F A = C
Two matrix decompositions are useful : Singular value decomposition (SVD) – the rows of F are orthogonal axes such that the maximum possible variation in the data lies along the first axis; the maximum of what remains along the second, and so on. The rows of C are coordinates in this space. Semidiscrete decomposition (SDD) – expresses A as a sum of matrices with the same shape, each of which represents a rectilinearly aligned region of similar magnitude (+ve and –ve). SDD creates an unsupervised ternary classification tree for objects. (Other matrix decompositions, such as independent component analysis can also be useful.)
Regard each row of the data matrix as a point in m-dimensional space. SVD maps correlation similarity proximity. This can be exploited in a number of ways: 1. Denoising (much more to come at this meeting). Truncating the SVD after some k dimensions removes `noise’, particularly helpful when the background is Gaussian. BUT when the goal is to look for anomalies, this can be dangerous. 2. Spectral clustering (much more to come at this meeting). There are several principled ways to do this – but they give different answers.
3. Distance from the origin corresponds to `interestingness’. Consider the object corresponding to the white vector… uncorrelated0 dot product positively correlated +ve dot product # objects >> # dimensions, so objects that are correlated with everything or with nothing must be close to the origin. Distance from the origin is a surrogate for interestingness. negatively correlated –ve dot product
In some number of dimensions … points corresponding to uninteresting objects most interesting objects
target 4. If a target is known, those points that are placed on the same side of the origin are those that are correlated with it.
target 3. and 4. can be exploited together Those points outside the yellow region are the least interesting.
5. The local neighborhoods of points that are in correlated groups are different from those of ordinary points. Choose an object; do an SVD; and discard the objects that are not correlated with it. Repeat with the remaining objects.
6. Weights can be added to either particular objects or particular attributes. This has the effect of moving them farther from the origin – but of pulling correlated points along with them. This may help to see structure hidden inside other structure. 7. There’s a very general way, due to Wedderburn, of forcing particular structure into a matrix decomposition. This can be used to discount existing knowledge so that the matrix decomposition looks only for new information. It’s hard to make use of this with artificial data.
SDD looks for regions based on their magnitude and the amount of the array they cover. Scaling the array values non-linearly tunes the techniques to look for small regions of large value or large regions of small value. SDD can be applied to: * the data matrix, A, directly * the object correlation matrix, A A’ * the correlation matrix Ak A’k obtained by truncating an SVD at k and remultiplying to get Ak (this matrix represents the higher-order correlation present in A). The last algorithm is usually most powerful and is called the JSS methodology.
3d visualization of SVD, red boxes: terrorist group; red star: target. (labelling done externally)
Remove uninteresting objects … 504 objects greater than median distance from the origin (Distances computed in 10 dimensions)
120 objects greater than 1.3 times the median distance from the origin
Remove uncorrelated objects … 462 objects correlated with the target
Remove both uninteresting and uncorrelated objects … 226 objects correlated with the target and greater than median distance from the origin
64 objects correlated with the target and greater than 1.3 times the median distance from the origin ~6% of the data, and all of the terrorist group still included.
Positions from SVD, labelling from SDD. Terrorist group have similar labels, but they can’t be picked out.
Position from SVD, labelling from SDD applied to the truncated correlation matrix. Now terrorist group is detected by the technique! N.B. the blue objects – potential aliases
These pictures are from an easy (but still not trivial) dataset, but the results extend to: * much more complex normally distributed data * Poisson distributed data (modeling e.g. travel patterns) * sparse data (up to 98% sparse) * binary data * binary sparse data although performance decreases as the amount of information in the data drops off.
Choosing appropriate attributes in this domain is hard. The dataset must contain some attributes for which the correlation among the terrorist group is different from the correlation in the general population. The number of such attributes required: * does not depend on the total number of attributes OR the total number of objects. * depends on how much smaller the variance within the terrorist group is than the variance of the whole population; For example, when the variance for the group is about half that of the general population, about 20 attributes are needed. For smaller variance, fewer attributes are needed. Adding attributes that might be useful does not hurt detection rates.
Summary: Detecting terrorist signatures in large datasets is difficult because they actively attempt to avoid leaving detectable traces. Correlation is the hardest form of signature to avoid because: * it’s forced by purpose, and * it’s hard to see `from the inside’, especially as an individual and so seems like the most fruitful direction for detection techniques. Matrix decompositions such as SVD and SDD are helpful in detecting and visualizing such correlation. However, they are best used as a triage mechanism, in preparation for more sophisticated downstream analysis techniques.
? www.cs.queensu.ca/home/skill skill@cs.queensu.ca Related material: D.B. Skillicorn, Detecting Related Message Traffic, Workshop on Link Analysis, Counterterrorism, and Privacy, SIAM International Conference on Data Mining 2004,39--48, April 2004. D.B. Skillicorn, Applying Matrix Decompositions to Counterterrorism, Queen's University, School of Computing, Technical Report 2004-484, May 2004, 47pp. The Athens system for novel information discovery. Data mining in sensor networks with correlated values.
Workshop on Link Analysis, Counter-terrorism, and Privacy, SIAM International Conference on Data Mining 2005, Sutton Place Hotel, Newport Beach, California, April 20-23, 2005 (submission date around Jan 2005). Watch for…