Download
1 / 28
330 likes | 646 Views
Issues of Generalized Causal Inference and Methods for Single Studies. Shadish , Cook and Campbell Chapters 10 and 11 Joy and Olivia . Agenda (approximation). 9-9:30 : Principals for Generalized Causal Inference and Typical/Heterogeneous Sampling (Joy) 9:30-55 : Activity 1 (You all)

E N D
Issues of Generalized Causal Inference and Methods for Single Studies Shadish, Cook and Campbell Chapters 10 and 11 Joy and Olivia
Agenda (approximation) 9-9:30: Principals for Generalized Causal Inference and Typical/Heterogeneous Sampling (Joy) 9:30-55: Activity 1 (You all) 9:55-10:15: Methods for Generalizing from Purposive Samples and Studying Causal Explanation in Single Studies (Olivia) 10:15-10:25: Break 10:25-10:50: Activity 2 (You all) 10:50-11:00: Wrap-up on single study methods (Olivia) 11:00-11:50: Standards of Evidence (Brian)
Generalized Causal Inference • Involves generalizing about a study’s UTOS: Units, Treatments, Outcomes, Settings • Researchers make these generalizations intuitively • The authors’ purpose is to describe and promote an explicit, standardized processfor generalizing • This improves: • Improves dissemination of results • Construct and external validity
Why not Formal Sampling? • Formal (random) sampling is ideal • But, real-world constraints can make random sampling difficult • Random sampling of units difficult when: • Attrition or non-compliance are high • Exact parameters of the population are not known • Samples of settings limited by cost and convenience • Researchers generally prefer that treatments and outcome measures be based in theory, and limited availability may make randomizing difficult • The alternative: Purposive sampling
Principles of Generalized Causal Inferencefor Purposive Sampling • Derived from authors’ observations of how generalizations are made (chart pg. 357) • Surface Validity • Ruling Out Irrelevancies • Making Discriminations • Interpolation and extrapolation • Causal Explanation • Purposive Sampling helps to locate heterogeneous or typical cases to study interactions
Principle 1: Surface Similarity • Judging apparent similarities between what was studied and the targets of generalization • Constructs: • ensuring face validity of constructs • matching surface characteristics to prototypical characteristics (ex. Unemployment) • External validity: easiest where proximal similarity is most evident (ex. Cancer treatment)
Principle 2: Ruling Out Irrelevancies • Identify attributes that don’t impact generalizability • Constructs: • Ruling out construct irrelevancies related to study design • Convergent validity – outcomes on different measures for similar constructs should correlate • Multiple operationalism differentiates between relevant and irrelevant features of measures • Heterogeneity of irrelevancies provides insight to which aspects of design are truly irrelevant • External validity: • Including heterogeneity of presumed irrelevancies strengthens design (Fisher, 1935) • May result in modifiers to the causal relationship
Principle 3: Making Discriminations • Discriminating between those UTOS that can and cannot be generalized to • Constructs: • Discriminating between constructs of interest and alternatives (discriminant validity, ex. Schizophrenia vs. Alzheimer’s) • External Validity: • Determining which UTOS might change causal relationships’ direction or strength
Principle 4:Interpolation and Extrapolation • Generalizing to unsampled values of the UTOS both within and outside the range of the sampled data • Constructs: • Interpolation requires accurate representation of the population • Confounding constructs with levels • Floor and ceiling effects • External validity: • Interpolation (ex. BMI) • Extrapolation • Confidence is highest closest to the range of the data Can you think of an example of when it is acceptable to extrapolate?
Principle 5: Causal Explanation • Developing and testing explanatory theories • Esp. for selecting treatments, measures • Constructs: • Deep or Structural Similarities may not always be apparent at the surface level • Construct Network describes relationships between constructs • External validity: in order to generalize, need to specify (1) which parts of treatment (2) affect which outcomes (3) through which causal mechanisms • Complete causal knowledge is a rarity
Purposive Sampling of UTOS • Typical instances are those that represent the mean, median, or mode of the UTOS of interest • Requires clear definitions of the “type” of interest • Heterogeneous instances are diversified on important characteristics • Lowers power, but can demonstrate a stronger relationship • Increases ability to identify irrelevancies, make discriminations, determine mediators, and inter/extrapolate • Surface similarities, ruling out irrelevancies, making discriminations, and inter/extrapolation can help determine what characteristics should be typical or heterogeneous
Time for an activity! • Form groups of 3-4 and select a program to evaluate from the list • Discuss the relevant UTOS (Units, Treatments, Outcomes, Settings). How do you know which ones to choose? • How do you use the Principles of Causal Generalization (Surface Similarity, Ruling out Irrelevancies, Making Discriminations, Inter/Extrapolation, Causal Explanation) and PSI-Typ/PSI-Het to design the study? (you don’t have to use every principle, just touch on the most useful ones for your case) • Be ready to report back! Programs:
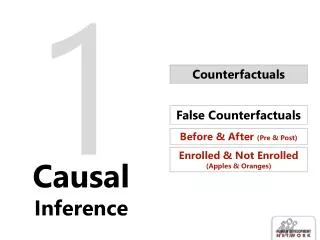
Let’s begin with the end • The classic method in stats for generalizability is formal probability sampling, but… • This is rarely feasible in experimental and quasi-experimental research. • Because of this we can strengthen the generalizability of causal inference by applying SCC’s five principles using • Statistical methods for generalizing from purposive samples, and/or • Methods for studying causal explanation. • Caveat: Described with respect to single studies.
Generalizing from Purposive Samples: Sample Reweighting • The main idea = by applying weights to our sample data (ideally on a purposive sample), we can generate population-ish estimates. • How close we come to this approximation depends on our knowledge of the pertinent population characteristics (i.e. if the info exists). • We also usually think of this only in terms of our units/cases/obs, namely people, vs. the other TOS.
Generalizing from Purposive Samples: Response Surface Modeling (RSM) • RSM logic: generalized causal inference is a prediction about the likely effect that would be obtained with the UTOS specified by the analyst as the target of generalization. • For example, we may want to understand what level(s) of x predict an optimal y. • Think “forecasting” or if you’ve had exposure to engineering “optimization.” • This is essentially regression modeling, but you need to have collected the right data to do it • (e.g. different levels of your main independent variables of interest).
RSM Example Source: Arch Intern Med. 2004;164(10):1121-1127. doi:10.1001/archinte.164.10.1121
Causal Explanation Methods • Qualitative methods—discovery focus • Statistical methods—measuring, not directly manipulating the UTOS during the study period • Manipulation of explanatory variables in experiments—strengthening the basis for asserting the causal roles of mediating variables
Qualitative Methods • Help us understand how and/or why interventions/programs/treatments/etc. work (or don’t). • May include participant observation, interviews, focus groups, etc. • Discrepancies in findings may arise when using mixed-methods (quantitative and qualitative). • How have you used qualitative methods in your work or for someone else’s to study causal explanation?
Statistical Methods (Yay!) • Main idea = We have a set of independent, dependent, mediating and moderating variables that we can use to model causal relationships with. • aka: Causal modeling, structural equation modeling, or covariance structure analysis. • Specific applications include path analysis, cross-lagged panel designs and latent variable structural models.
What is the difference between mediation and moderation/interaction? • Two examples Diagrams adopted from: http://academic.csuohio.edu/kneuendorf/c63111/hand22.pdf
Path Diagrams • Main idea = “[A] graphical model that [structures] hypothesized causal and correlational relationships among all measures” (p. 393). • Force us to thoughtfully specify models and test the goodness/lack of fit of what we hypothesized based on the results. • Paths may be direct or indirect.
Two Examples Exercise/weight loss figures adopted from: http://crab.rutgers.edu/~goertzel/pathanal.htm Rejection/identification model from article by Branscombe et al. 1999.
Semantics • Path coefficient = the parameter being estimated • Endogenous variable = variables that receive causal inputs from other variables in the model (they have an arrow going into them). • Exogenous variable = no causal inputs • Error terms = additional variance influencing endogenous variables (e.g. measurement error) • Non-recursive causation = when two variables influence one another (i.e. the relationship is bi-directional).
Now you give it a whirl • Get back into your group from earlier and create a simple path diagram for the intervention/program you picked. • You don’t need to include all of the potential variables, just select an outcome, predictor, mediator and/or modifier. • Extra credit for writing your path equations (p. 397). • Be ready to draw it and explain briefly. • You have 15 minutes to work on this.
Things to keep in mind • Measurement error may bias path coefficients. • Omitted variables may bias models. • Misspecification of relationships and/or their functional form may bias estimates. • Make sure the assumptions of tests you use are met. • Tests of individual model parts may lower power, so sample size is important.
More applications • Cross-lagged panel correlational design = measuring cause and effect together at two times to see if cross-lagged correlations differ. • If a stronger association exists between Time 1 Cause and Time 2 Effect than Time 1 Effect and Time 2 Cause, then we can better infer a causal relationship. (image p. 412) • Instrumental variable approaches = Including factors in analyses hypothesized to indirectly influence outcome(s). See Urban Institute Tool Kit for more info: http://www.urban.org/toolkit/data-methods/instrumental.cfm • Latent variable modeling = separating variance due to the latent construct from variance due to unique and random error components (e.g. factor analysis). • Can help us to suss out if our measures are indicative of what we think they are, or show multiple latent variables in a single measure • Examples?
Manipulation of explanatory variables in experiments • Why? Helps to determine the effects of potential mediators within our causal explanation framework. • Blockage models = block the mediator to see if the relationship between cause and effect changes as hypothesized. • Enhancement models = test of cause and effect followed by another test in which the mediating factor is added to see if enhancement of effect occurs as hypothesized. • Pattern matching = testing meditational paths hypothesized to result in different outcomes and seeing if the observed pattern matches any hypothesized pattern(s).