Download
1 / 66
660 likes | 667 Views
Transportation & Supply Chain Systems. John H. Vande Vate Spring 2005. Who am I?. John H. Vande Vate Professor and EMIL Executive Director Office: 221(?) of the Old ISyE bldg. Used to be the graduate student lounge. Same area as the TLI. Phone: (404) 894-3035 Office Hours:

E N D
Transportation & Supply Chain Systems John H. Vande Vate Spring 2005 1
Who am I? • John H. Vande Vate • Professor and EMIL Executive Director • Office: 221(?) of the Old ISyE bldg. Used to be the graduate student lounge. Same area as the TLI. • Phone: (404) 894-3035 • Office Hours: • Tuesday, Thursday 3-5 (after class) or • By appointment 2
Our TA • Claudio Santiago • csantiag@isye.isye.gatech.edu • Office: • Hours: TBA 3
Administrative Details • Class Home Page: www.isye.gatech.edu/~jvandeva/Classes/6203/syllabus2005.html Keep up with information here! 4
Text • Introduction to Logistics Systems Planning and Control byGianpaolo Ghiani, Gilbert Laporte, Roberto Musmanno • Publisher: Wiley • ISBN: 0-470-84917-7 • Edition: Jan 2004 (This text was used in the Fall Semester, 2004 so it should be possible to get used copies. The hard cover copy lists for $148 at Amazon, the paperback edition lists for $65.12 which is even less expensive than the digital version at $65.95) 5
Other Resources • You may also want to read: • Contemporary Logistics by Johnson, Wardlow, Wood and Murphy • Logistic Systems Analysis by Daganzo • Business Logistics Management 4th Edition by R. H. Ballou, Prentice Hall, 1999 • Bramel, J. and D. Simchi-Levi, The Logic of Logistics: Theory, Algorithms and Applications for Logistics Management, Springer-Verlag, 1997 • Logistics and Supply Chain Management: Strategies for Reducing Cost and Improving Service (2nd Edition) by Martin Christopher • Modeling the Supply Chain by Jeremy F. Shapiro 6
Grading • Exams: 40% • January 27th 20% • March 17th20%May 2nd 11:30 - 2:20 20% • You may drop your lowest exam • Project 1: 20% • Groups of 6 or 7 • Project 2: 20% • Homework: 20% 7
Objectives • Knowledge and understanding of the issues underlying transportation and supply chain management and • Mastery of the tools and models to support intelligent resolution of those issues. 8
Projects • Project 1: Financial Assessment • Team of up to 5 students • Assign a company to each team member • The companies must all be competitors • You will want to select publicly traded companies at least 5 years old 9
Project 1 Cont’d • For your assigned company • Part A: Due February 1st • Collect Balance Sheets, Income Statements, Annual Reports, news articles, etc. going back at least 5 years • Over a period extending back at least 5 years calculate • Days of Inventory • Days Sales Outstanding • Days Payments Outstanding • NOPAT/Revenue • Revenue/Capital • Return on Investment • Total Shareholder Return • Compare these across your teams’ companies • Draw conclusions about the relationships between these metrics and Total Shareholder Return. 10
Project 1 Cont’d • For your assigned company • Part B: Due April 21st • Imagine you have been hired as VP of Supply Chain for your company, describe what initiatives you would pursue and how they would affect the above measures. 11
Project 1 Deliverables • Part A: In a ZIP archive • An HTML page or Word document that organizes the information about the companies (and identifies who was responsible for each company) including references (where possible include copies of the referenced documents in the zip archive) • Part B: A Powerpoint presentation (to the executive committee of your company) motivating and explaining your proposals and projecting their value to the company. • Submit these documents in electronic format. DO NOT SUBMIT PAPER COPIES 12
Project 2 • Also in teams of up to 5 • Regional Transportation and Supply Chain Infrastructure and Issues • Asia • Latin America • Europe • Approved special topic 13
Project 2: Schedule January 27th: Submit your team composition and selected topic to me via e-mail February 15th: Submit an outline of your report with assigned responsibilities to me via e-mail April 14th: Submit your report to me via e-mail 14
Project 2 Topics Asian Logistic Networks. This should provide a comprehensive overview of the key freight transportation systems in the region bounded by China, India, Australia and Japan. It should describe: • the key goods moving in the region, • the flows of these goods, • the modes these goods move by, • the principal carriers, • the key transport facilities (ports, airports, etc) • the different roles organizations play in the process • special challenges to shippers and carriers in the region • Include a comprehensive annotated bibliography (describe the value of each entry in the bibliography) • Example to build on and update available 15
Project Topics Latin American Logistic Networks. This should provide a comprehensive overview of the key freight transportation systems in South and Central America. It should describe: • the key goods moving in the region, • the flows of these goods, • the modes these goods move by, • the principal carriers, • the key transport facilities (ports, airports, etc) • the different roles organizations play in the process • special challenges to shippers and carriers in the region • Include a comprehensive annotated bibliography (describe the value of each entry in the bibliography) • Example to build on and update available 16
Project Topics Central and Eastern European Logistic Networks. This should provide a comprehensive overview of the key freight transportation systems in Central and Eastern Europe It should describe: • the key goods moving in the region, • the flows of these goods, • the modes these goods move by, • the principal carriers, • the key transport facilities (ports, airports, etc) • the different roles organizations play in the process • special challenges to shippers and carriers in the region • Include a comprehensive annotated bibliography (describe the value of each entry in the bibliography) • See Asian and Latin American examples 17
Project Topics Alternative project proposals are welcome. E-mail me an outline of the content of your report before January 20th. Alternative projects must be approved. Video students may either join a team or work alone as they prefer. I encourage video students to select a project related to their companies. Be careful to ensure that proprietary concerns will not prevent your sharing the project report with me. 18
Algebraic Modeling Languages • AMPL • www.ampl.com - Free student version • AMPL A Modeling Language for Mathematical Programming, Fourer, Gay and Kernighan • No full version generally available • XPress-MP: • Full version available in the graduate and undergraduate labs. 19
More Options • AIMMS: • This application is supported in the Lab. • Student version?? • MPL or related tools: • Can be downloaded free from www.maximal-usa.com/download/ • No full version available • OPL Studio Free trial version at www.ilog.com/products/oplstudio/trial.cfm 20
Worst Option • Solver in Excel • Not industrial strength • Not reliable • Model and data confounded • But if you’re really struggling… 21
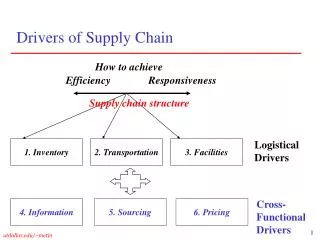
Schedule • Working with Certainty • Introductory Example • The role of Frequency • Financial Implications • Network Design • Location • Routing • Case Study 22
Schedule • Working with Uncertainty • Forecasting • Planning • Variability and the Bullwhip Effect • Risk Pooling & Postponement • Inventory • Hedging • Revenue Management 23
Schedule • Working Internationally • Incoterms • Customs, Duties, Free Trade Zones,… 24
Illustrative Example • Develop a distribution strategy to minimize inventory and transportation costs • Purpose: • Outline issues covered in outbound logistics • The importance of transportation in the supply chain • Illustrate costs and investments 25
Overview • Products: • Computers: CPU, Monitor, Keyboard • Televisions: TV and Console • Distribution Centers • 100 across the US • Sell 10 TVs and 10 computers per day • 250 days/year 26
Components 27
Initial Strategies to Consider • All direct shipments in full truckloads • Consolidate in Indianapolis. All shipments in full truckloads 28
Simplification • Shipments on the order of 1,000 miles Distances 29
What Costs? • Transportation • Pipeline inventory – inventory in transit • Inventory at Plants • Inventory at DCs • Handling • … 30
Direct:Transportation Cost • How many shipments/year? • Green Bay • Indianapolis • Denver • Total 100 stores * Annual Store Demand /Items to fill a truck Items to fill a truck = Cap. of truck/Weight of Item • Green Bay • Indianapolis • Denver 100*2,500/6,000 = 41.67 100*5,000/3,000 =166.67 100*2,500/1,000 = 250 ~ 460 30,000/5 = 6,000 30,000/10 = 3,000 30,000/30 = 1,000 31
What Costs? • Direct • Transportation ~ • $1/mile*1,000 miles/trip*460 trips/year = $460,000/year • Pipeline inventory • Inventory at Plants • Inventory at DCs • Handling • … 32
Pipeline Inventory • How long are goods in transit? • 1,000 miles at 50+ miles per hour • 2 days + • How much inventory is in transit on average? • Imagine we send the items one-at-a-time • How many items in the pipe? 33
Pipeline Inventory • One Day worth of sales at a store • 10 TVs at $400+$100 each = $5,000 • 10 Computers at $300+$400 = $7,000 • Total $12,000 per day per store • Two days of system-wide sales: • 2 days * $12,000/store/day * 100 stores = $2,400,000 • Carrying cost 15% of $2,400,000 = $360,000 34
What Costs? • Direct • Transportation ~ • $1/mile*1,000 miles/trip*460 trips/year = $460,000/year • Pipeline inventory • $2,400,000 in capital • $360,000 in annual carrying costs • Inventory at Plants • Inventory at DCs • Handling • … 35
Inventory at the Plants • Two Extremes • Simultaneous shipments • Staggered shipments 36
Simultaneous Shipments • A truckload of computers from Green Bay has 6,000 computers in it • A DC sells 2,500 per year • So we only need to replenish the DCs every 6,000/2,500 = 2.4 years 37
Inventory at Green Bay • Simultaneous Shipments 600,000 2.4 years 38
Simultaneous shipments • Green Bay ships once every 2.4 years • Inventory is 1.2 years demand or 300,000 CPUs • Inventory value is $90,000,000 • Inventory carrying cost is $13,500,000 • Denver ships 2.5 times per year • Inventory is 20% of annual demand or 50,000 Consoles • Inventory value is $5,000,000 • Inventory carrying cost is $750,000 • Indianapolis ships 1.6 times per year • Inventory is 500,000/3.2 or about 150,000 items • Inventory value is $60,000,000 • Inventory carrying cost is $9,000,000 39
Why Not? • What are problems with simultaneous shipments? • When are simultaneous shipments likely? • What alternatives? 40
Inventory at Green Bay • Staggered Shipments 6,000 ~6 days 41
What Costs? • Inventory at Plants • Simultaneous Shipments Capital Carrying Cost • Green Bay $90 million $13.5 million • Denver $ 5 million $ .75 million • Indianapolis $60 million $ 9.0 million • Total $155 million $23.25 million • Staggered Shipments (divide by 100!) Capital Carrying Cost • Green Bay $900 K $135 K • Denver $ 50 K $ 7.5 K • Indianapolis $600 K $ 90 K • Total $1.55 million $232.5 K 42
What Costs? • Direct • Transportation ~ • $1/mile*1,000 miles/trip*460 trips/year = $460,000/year • Pipeline inventory • $2,400,000 in capital • $360,000 in annual carrying costs • Inventory at Plants – Staggered Shipments • $1.55 million in capital • $232.5 K in annual carrying costs • Inventory at DCs • Handling • … 43
DC Inventory from Green Bay 6,000 ~2.4 years 44
Inventory at DCs • At the DC’s? • ½ truckload or 3,000 CPUs at $300 each: $900,000 • ½ truckload or 1,500 Monitors at $400 each: $600,000 • ½ truckload or 500 Consoles at $100 each: $ 50,000 $1,550,000 Carrying cost: 15% of $1,550,000 or $232,500 Total Carrying cost at the DCs: $23,250,000! 45
What Costs? • Direct • Transportation ~ • $1/mile*1,000 miles/trip*460 trips/year = $460,000/year • Pipeline inventory • $2,400,000 in capital • $360,000 in annual carrying costs • Inventory at Plants – Staggered Shipments • $1.55 million in capital • $232.5 K in annual carrying costs • Inventory at DCs • $155 million in capital • $23.25 million in carrying costs • Handling • … 46
Total Cost & Capital Direct Costs • Transportation Costs: $ 460,000 • Pipeline Inventory $ 360,000 • Inventory Costs at Plants: $ 232,500 • Inventory Costs at DCs: $ 23,250,000 Total: $ 24,302,500! Capital Required: • Pipeline Inventory $ 2,400,000 • Inventory Costs at Plants: $ 1,550,000 • Inventory Costs at DCs: $ 155,000,000 Total: $ 158,950,000! 47
Consolidation • Strategy 2: Assemble Products in Indianapolis and distribute by truckload from there • What will happen to costs? • Transportation • Pipeline • At plants • At Indianapolis Warehouse/Cross Dock • At DCs 48
Via Indianapolis Facts 49
What Costs? • Transportation • To Indianapolis • From Indianapolis to DCs • Pipeline inventory • To Indianapolis • From Indianapolis to DCs • Inventory at Plants • Inventory at Indianapolis Cross Dock • Inventory at DCs • Handling • … 50