Download
1 / 56
560 likes | 850 Views
Lecture 13: Protein Function. Bioinformatics Master Course: DNA/Protein Structure-Function Analysis and Prediction. Sequence-Structure-Function. Ab initio prediction and folding. Sequence Structure Function. impossible but for the smallest structures. Threading.

E N D
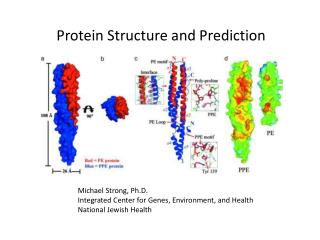
Lecture 13: Protein Function Bioinformatics Master Course:DNA/Protein Structure-Function Analysis and Prediction
Sequence-Structure-Function Ab initio prediction and folding Sequence Structure Function impossible but for the smallest structures Threading Function prediction from structure Homology searching (BLAST) very difficult
Functional Genomics – Systems Biology Genome Expressome Proteome TERTIARY STRUCTURE (fold) Metabolome TERTIARY STRUCTURE (fold) Metabolomics fluxomics
Systems Biology is the study of the interactions between the components of a biological system, and how these interactions give rise to the function and behaviour of that system (for example, the enzymes and metabolites in a metabolic pathway). The aim is to quantitatively understand the system and to be able to predict the system’s time processes • the interactions are nonlinear • the interactions give rise to emergent properties, i.e. properties that cannot be explained by the components in the system • Biological processes include many time-scales, many compartments and many interconnected network levels (e.g. regulation, signalling, expression,..)
Systems Biology understanding is often achieved through modeling and simulation of the system’s components and interactions. Many times, the ‘four Ms’ cycle is adopted: Measuring Mining Modeling Manipulating
‘The silicon cell’ (some people think ‘silly-con’ cell)
A system response Apoptosis: programmed cell death Necrosis: accidental cell death
Human Yeast ‘Comparative metabolomics’ We need to be able to do automatic pathway comparison (pathway alignment) This pathway diagram shows a comparison of pathways in (left) Homo sapiens(human) and (right)Saccharomycescerevisiae(baker’s yeast). Changes in controlling enzymes (square boxes in red) and the pathway itself have occurred (yeast has one altered (‘overtaking’) path in the graph)
The citric-acid cycle http://en.wikipedia.org/wiki/Krebs_cycle
The citric-acid cycle Fig. 1. (a) A graphical representation of the reactions of the citric-acid cycle (CAC), includingthe connections with pyruvate and phosphoenolpyruvate, and the glyoxylate shunt.When there are two enzymes that are not homologous to each other but that catalyse thesame reaction (non-homologous gene displacement), one is marked with a solid line andthe other with a dashed line. The oxidative direction is clockwise. The enzymes with theirEC numbers are as follows: 1,citrate synthase (4.1.3.7); 2, aconitase (4.2.1.3); 3, isocitratedehydrogenase (1.1.1.42); 4, 2-ketoglutarate dehydrogenase(solid line; 1.2.4.2 and2.3.1.61) and 2-ketoglutarate ferredoxin oxidoreductase (dashed line; 1.2.7.3); 5, succinyl-CoA synthetase (solid line; 6.2.1.5) or succinyl-CoA–acetoacetate-CoA transferase(dashed line; 2.8.3.5); 6, succinate dehydrogenase or fumarate reductase (1.3.99.1); 7,fumarase (4.2.1.2) class I (dashed line) and class II (solid line); 8, bacterial-type malatedehydrogenase (solid line) or archaeal-type malate dehydrogenase (dashed line)(1.1.1.37); 9, isocitrate lyase (4.1.3.1); 10, malate synthase (4.1.3.2); 11, phosphoenolpyruvatecarboxykinase (4.1.1.49) or phosphoenolpyruvate carboxylase (4.1.1.32);12, malic enzyme (1.1.1.40 or 1.1.1.38); 13, pyruvate carboxylase or oxaloacetate decarboxylase(6.4.1.1); 14, pyruvate dehydrogenase (solid line; 1.2.4.1 and 2.3.1.12) andpyruvate ferredoxin oxidoreductase (dashed line; 1.2.7.1). M. A. Huynen, T. Dandekar and P. Bork ``Variation and evolution of thecitric acid cycle: a genomic approach'' Trends Microbiol, 7, 281-29 (1999)
The citric-acid cycle b) Individual species mightnot have a complete CAC. This diagram shows the genes for the CAC for each unicellularspecies for which a genome sequence has been published, together with the phylogeny ofthe species. The distance-based phylogeny was constructed using the fraction of genesshared betweengenomes as a similarity criterion29. The major kingdoms of life are indicatedin red (Archaea), blue (Bacteria) and yellow (Eukarya). Question marks representreactions for which there is biochemical evidence in the species itself or in a relatedspecies but for which no genes could be found. Genes that lie in a single operon areshown in the same color.Genes were assumed to be located in a single operon whenthey were transcribed in the same direction and the stretches of non-coding DNA separatingthem were less than 50 nucleotides in length. M. A. Huynen, T. Dandekar and P. Bork ``Variation and evolution of thecitric acid cycle: a genomic approach'' Trends Microbiol, 7, 281-29 (1999)
Experimental Structural genomics Functional genomics Protein-protein interaction Metabolic pathways Expression data
Communicability: Functional Genomics Interpretation of genome-scale gene expression data External Program DNA-chip data • Cluster of coregulated genes • gene 1 • gene 2 • ... • gene n PFMP query • Pathways affected • pathway 1 • pathway 2
Communicability: Functional Genomics Interpretation of genome-scale gene expression data External Programs DNA-chip data • Cluster of coregulated genes • gene 1 • gene 2 • ... • gene n • Pattern discovery • gene 1 • gene 2 • ... (putative regulatory sites) • Similarities with known regulatory sites • site 1 Factor 1 • site 2 Factor 2 • ... PFMP query
Other Issues Partial information (indirect interactions) and subsequent filling of the missing steps Negative results (elements that have been shown not to interact, enzymes missing in an organism) Putative interactions resulting from computational analyses
Protein function categories Catalysis (enzymes) Binding – transport (active/passive) Protein-DNA/RNA binding (e.g. histones, transcription factors) Protein-protein interactions (e.g. antibody-lysozyme) (experimentally determined by yeast two-hybrid (Y2H) or bacterial two-hybrid (B2H) screening ) Protein-fatty acid binding (e.g. apolipoproteins) Protein – small molecules (drug interaction, structure decoding) Structural component (e.g. -crystallin) Regulation Signalling Transcription regulation Immune system Motor proteins (actin/myosin)
Catalytic properties of enzymes Vmax × [S] V = ------------------- Km + [S] Michaelis-Menten equation: Km kcat E + S ES E + P • E = enzyme • S = substrate • ES = enzyme-substrate complex (transition state) • P = product • Km = Michaelis constant • Kcat = catalytic rate constant (turnover number) • Kcat/Km = specificity constant (useful for comparison) Vmax Moles/s Vmax/2 Km [S]
Protein interaction domains http://pawsonlab.mshri.on.ca/html/domains.html
Energy difference upon binding Examples of protein interactions (and functional importance) include: Protein – protein (pathway analysis); Protein – small molecules (drug interaction, structure decoding); Protein – peptides, DNA/RNA (function analysis) The change in Gibb’s Free Energy of the protein-ligand binding interaction can be monitored and expressed by the following; G = H – T S (H=Enthalpy, S=Entropy and T=Temperature)
Experimentally measuring PPIs Yeast two-hybrid TF: DNA binding and activation domain together set transcription in motion Yeast strains of opposite mating types Prey – Activation domain Bait – TF binding domain Bait and Prey have to interact to activate reporter gene Make yeast strains mate and have an easily observable reporter gene (e.g. luciferase) with appropriate TFBS
Experimentally measuring PPIs Tandem affinity purification (TAP) Add TAP tag at end of target gene containing an IgG domain Separate protein-TAP-IgG complexes using affinity column containing IgG beads Wash off the column, target-IgG complex stays behind If target protein interacts with others, these are also retained on the column Separate proteins using SDS-PAGE and identify using mass-spec Can also use other protein in complex as target protein to verify complex formation
Protein function Many proteins combine functions For example, some immunoglobulin structures are thought to have more than 100 different functions (and active/binding sites) Alternative splicing can generate (partially) alternative structures
Protein function & Interaction Active site / binding cleft Shape complementarity
Protein function evolution Chymotrypsin
How to infer function Experiment Deduction from sequence Multiple sequence alignment – conservation patterns Homology searching Deduction from structure Threading Structure-structure comparison Homology modelling
Cholesterol Biosynthesis: Cholesterol biosynthesis primarily occurs in eukaryotic cells. It is necessary for membrane synthesis, and is a precursor for steroid hormone production as well as for vitamin D. While the pathway had previously been assumed to be localized in the cytosol and ER, more recent evidence suggests that a good deal of the enzymes in the pathway exist largely, if not exclusively, in the peroxisome (the enzymes listed in blue in the pathway to the left are thought to be at least partly peroxisomal). Patients with peroxisome biogenesis disorders (PBDs) have a variable deficiency in cholesterol biosynthesis
Cholesterol Biosynthesis: from acetyl-Coa to mevalonate Mevalonate plays a role in epithelial cancers: it can inhibit EGFR
Epidermal Growth Factor as a Clinical Target in Cancer A malignant tumour is the product of uncontrolled cell proliferation. Cell growth is controlled by a delicate balance between growth-promoting and growth-inhibiting factors. In normal tissue the production and activity of these factors results in differentiated cells growing in a controlled and regulated manner that maintains the normal integrity and functioning of the organ. The malignant cell has evaded this control; the natural balance is disturbed (via a variety of mechanisms) and unregulated, aberrant cell growth occurs. A key driver for growth is the epidermal growth factor(EGF) and the receptor for EGF (the EGFR) has been implicated in the development and progression of a number of human solid tumours including those of the lung, breast, prostate, colon, ovary, head and neck.
Energy housekeeping: Adenosine diphosphate (ADP) – Adenosine triphosphate (ATP)
Signal Transduction Important signalling pathways: Map-kinase (MapK) signalling pathway, or TGF- pathway
Multiple Levels of Regulation Gene expression Protein activity Protein intracellular location Protein degradation Substrate transport