Download
1 / 28
280 likes | 531 Views
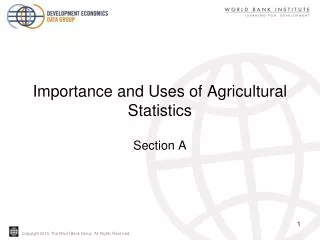
GIS-based estimation of loss of farmland to non-agricultural uses. Nordic Forum for Geography and Statistics Oslo, May 2017 Geir Inge Gundersen and Margrete Steinnes. Background. Agricultural area in Norway: 1 113 000 ha 3.7 per cent of the main land.

E N D
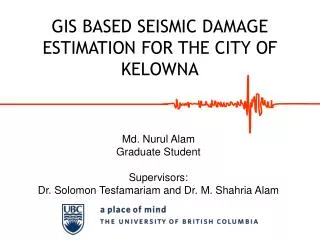
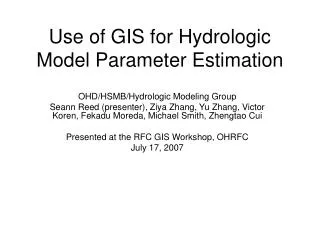
GIS-based estimation of loss of farmland to non-agricultural uses Nordic Forum for Geography and Statistics Oslo, May 2017 Geir Inge Gundersen and Margrete Steinnes
Background • Agricultural area in Norway: • 1 113 000 ha • 3.7 per cent of the main land Agricultural area in use, by 1x1 km grid. Decares
Sandnes - 2016 Sandnes - 1960
National policy • National aims for the protection of farmland • Strategy 2015: The yearly conversion of agricultural land to non-agricultural uses should be below 400 hectares within 2020
Local administration of agricultural areas • Agricultural area transferred to non-agricultural uses under the provision of the Land Act and The Planning and Building Act • KOSTRA is an abbreviation for Municipality-State-Reporting. The data collection includes most of the municipal and county municipal activities. The KOSTRA-project started in 1995. As from 2005, the reporting system also includes agricultural topics
Creating a project • Co-operative project between Statistics Norway and the Norwegian Institute of Bioeconomy Research • Project plan November 2015 • Project start spring 2016 • Publishing our report june 6.
Why we don’t produce annual statistics on loss of farmland • Statistics Norway produces an annual land use map • Multiple editions; to find newly developed areas • Compare to area resource map to find changes • But; • May take time before objects are mapped • Multiple year registrations in one go • Complex figures (based on multiple data sources) May take several years before they are correct and stable • In a GIS-analysis these are the changes that are captured
Agricultural land in AR5 2010 «zero-point» for the analysis • National Land Resource Map in scale 1:5000 named AR5 • The national primary source of detailed information on Norway's land resources • The Norwegian Institute of Bioeconomyhas the technical responsibility for the National Land Resource Map • Continuously updated by the municipalities • Updated periodically by use of air photos (5-7 years)
AR5 2010 • The periodically update for the whole country was finalised in 2010 • The year of air photos will vary between the municipalities
Land Use 2016 – «end-point» for the analysis • Use the best available data base where such data exists • Building polygon / Building Point • Roads as polygons/ roads as lines • Organized and put together in hierarchy • Completeness and quality as good as possible
Built-up areas in the Land Use Map 2. Built-up buffer 1. Built-up area figures
Method • Overlay analysis • Agricultural area before 2010 + Land Use 2016 Areas transferred to built-up land • The result consist of: • Real changes (conversion of agricultural land to non-agricultural land) • Revision of map objects (small adjustments when the same object is sketched again) • How to deal with these phenomena? • Aim: • Remove changes that is not real (e.g. adjustments of an object’s border) • Keep real changes
Map revision • Method: • Remove slivers (< 5 m) • Remove areas (< 500 m2) What is different What is considered as a real change 2005 2015
Example - dwellings 2003 2015 Dwellings
Method- roads • New road- connected to oldroads in junctions • Areas that has long lines in commonwith older roads • Might be extensionofoldroad • But more likely to be the same road, drawn in a different way • Calculatehowmuchoftheroadsidelinesthatarecommon • A lownumberindicates a newroad Blue- new Pink- mapadjustments
Figures > 500 m2 Figures with a building Agricultural land. 2005 New roads Buildings with buffer zones Residue areas
Method- overview • Objects withbuildings • Minimum width 5 meter, minimum size 500 m2 • Holiday houses • Chosen by buildingyear • Greenhouses • Not theactual greenhouse (defined as fullycultivated), but a built-up area around (max 2 meter) • Roads • Onlynewroads, defined from whatweknowaboutoldroads • Sport grounds, industrial areas, parkingetc • Minimum width 5 meter, minimum size 500 m2 • Airports, shooting ranges, skislopes • Not included • Residue areas
Problem- forest • The same method has beentried for cultivable areas (mostlyforest) • Raisesmany problems, amongthem: • Roads are not mapped • To manywill be interpreted as new
Dissemination • Report -6th of June • Method • Results • Web Map Service (WMS) • Register quality (AR5) • Quality control