Download
1 / 1
10 likes | 151 Views
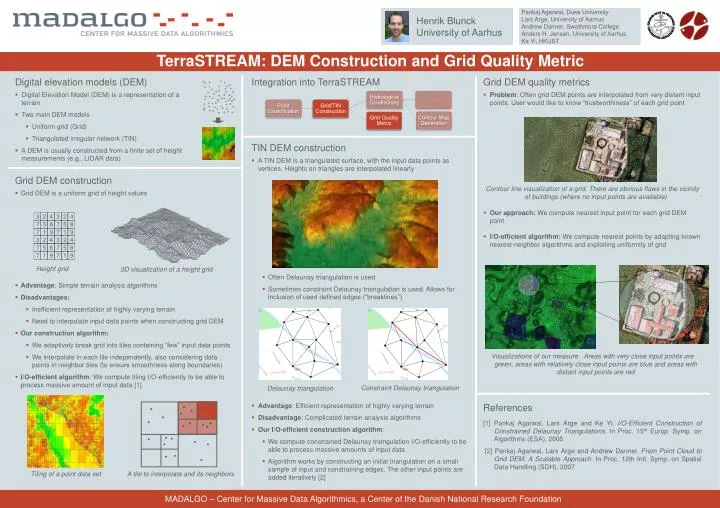
Henrik Blunck University of Aarhus. Pankaj Agarwal, Duke University Lars Arge, University of Aarhus Andrew Danner, Swathmore College Anders H. Jensen, University of Aarhus Ke Yi, HKUST. TerraSTREAM: DEM Construction and Grid Quality Metric. Digital elevation models (DEM)

E N D
Henrik Blunck • University of Aarhus Pankaj Agarwal, Duke University Lars Arge, University of Aarhus Andrew Danner, Swathmore College Anders H. Jensen, University of Aarhus Ke Yi, HKUST • TerraSTREAM: DEM Construction and Grid Quality Metric • Digital elevation models (DEM) • Digital Elevation Model (DEM) is a representation of a terrain • Two main DEM models • Uniform grid (Grid) • Triangulated irregular network (TIN) • A DEM is usually constructed from a finite set of height measurements (e.g., LIDAR data) Integration into TerraSTREAM • Grid DEM quality metrics • Problem: Often grid DEM points are interpolated from very distant input points. User would like to know “trustworthiness” of each grid point Contour line visualization of a grid. There are obvious flaws in the vicinity of buildings (where no input points are available) • Our approach: We compute nearest input point for each grid DEM point • I/O-efficient algorithm: We compute nearest points by adapting known nearest-neighbor algorithms and exploiting uniformity of grid Visualizations of our measure. Areas with very close input points are green, areas with relatively close input points are blue and areas with distant input points are red • TIN DEM construction • A TIN DEM is a triangulated surface, with the input data points as vertices. Heights on triangles are interpolated linearly • Often Delaunay triangulation is used • Sometimes constraint Delaunay triangulation is used. Allows for inclusion of used defined edges (“breaklines”) • Advantage: Efficient representation of highly varying terrain • Disadvantage: Complicated terrain analysis algorithms • Our I/O-efficient construction algorithm: • We compute constrained Delaunay triangulation I/O-efficiently to be able to process massive amounts of input data • Algorithm works by constructing an initial triangulation on a small sample of input and constraining edges. The other input points are added iteratively [2] • Grid DEM construction • Grid DEM is a uniform grid of height values • Advantage: Simple terrain analysis algorithms • Disadvantages: • Inefficient representation of highly varying terrain • Need to interpolate input data points when constructing grid DEM • Our construction algorithm: • We adaptively break grid into tiles containing “few” input data points • We interpolate in each tile independently, also considering data points in neighbor tiles (to ensure smoothness along boundaries) • I/O-efficient algorithm: We compute tiling I/O-efficiently to be able to process massive amount of input data [1] 3 2 4 3 2 4 7 5 8 7 5 8 7 1 9 7 1 9 3 2 4 3 2 4 7 5 8 7 5 8 7 1 9 7 1 9 Height grid 3D visualization of a height grid Constraint Delaunay triangulation Delaunay triangulation References [1] Pankaj Agarwal, Lars Arge and Ke Yi. I/O-Efficient Construction of Constrained Delaunay Triangulations. In Proc. 15th Europ. Symp. on Algorithms (ESA), 2005 [2] Pankaj Agarwal, Lars Arge and Andrew Danner. From Point Cloud to Grid DEM: A Scalable Approach. In Proc. 12th Intl. Symp. on Spatial Data Handling (SDH), 2007 Tiling of a point data set A tile to interpolate and its neighbors MADALGO – Center for Massive Data Algorithmics, a Center of the Danish National Research Foundation