Download
1 / 40
520 likes | 1.16k Views
Data Warehouse DSS Business Intelligence Minder.Chen@CSUCI.EDU. BI Evolution. Source: META Group Inc. History. Legacy. Current. 2005+. MIS Reports. Decision Support Systems. Business Intelligence. Business Performance Management. Hand coded. Report writers. OLAP.

E N D
Data Warehouse DSS Business Intelligence Minder.Chen@CSUCI.EDU
BI Evolution Source: META Group Inc. History Legacy Current 2005+ MIS Reports Decision Support Systems Business Intelligence Business Performance Management • Hand coded • Report writers • OLAP • Dashboard/mining • Single system data • Joined operating data • DW • Enterprise portals • Summary metrics • Statistical metrics • Predictive metrics • Recommendations • Extreme latency • Extreme cost • Extreme ‘infoglut’ • Extreme integration Moving beyond one-way info delivery to true BPM
BI Questions • What happened? • What were our total sales this month? • What’s happening? • Are our sales going up or down, trend analysis • Why? • Why have sales gone down? • What will happen? • Forecasting & “What If” Analysis • What do I want to happen? • Planning & Targets Source: Bill Baker, Microsoft
BI “The key in business is to know something that nobody else knows.” -- Aristotle Onassis PHOTO: HULTON-DEUTSCH COLL Business Intelligence (BI) is the process of gathering meaningful information to answer questions and identify significant trends or patterns, giving key stakeholders the ability to make better business decisions. “To understand is to perceive patterns.” — Sir Isaiah Berlin "The manager asks how and when, the leader asks what and why." — “On Becoming a Leader” by Warren Bennis
BI Definition • Business intelligence provides the ability to transform data into usable, actionable information for business purposes. BI requires: • Collections of quality data and metadata important to the business • The application of analytic tools, techniques, and processes • The knowledge and skills to use business analysis to identify/create business information • The organizational skills and motivation to develop a BI program and apply the results back into the business
Business Intelligence Increasing potential to support business decisions (MIS) End User Making Decisions Business Analyst Data Presentation Visualization Techniques Data Analyst Data Mining Information Discovery Data Exploration OLAP, MDA, Statistical Analysis, Querying and Reporting Data Warehouses / Data Marts DBA Data Sources (Paper, Files, Information Providers, Database Systems, OLTP)
Inmon's Definition of Data Warehouse – Data View • A warehouse is a • subject-oriented, • integrated, • time-variant and • non-volatile collection of data in support of management's decision making process. • Bill Inmon in 1990 Source: http://www.intranetjournal.com/features/datawarehousing.html
Inmon's Definition Explain • Subject-oriented: They are organized around major subjects such as customer, supplier, product, and sales. Data warehouses focus on modeling and analysis to support planning and management decisions v.s. operations and transaction processing. • Integrated: Data warehouses involve an integration of sources such as relational databases, flat files, and on-line transaction records. Processes such as data cleansing and data scrubbing achieve data consistency in naming conventions, encoding structures, and attribute measures. • Time-variant: Data contained in the warehouse provide information from an historical perspective. • Nonvolatile: Data contained in the warehouse are physically separate from data present in the operational environment.
The Data Warehouse Process Data Marts and cubes Source Systems Clients Data Warehouse Query Tools Reporting Analysis Data Mining 1 2 3 4 Design the Populate Create Query Data Warehouse Data Warehouse OLAP Cubes Data
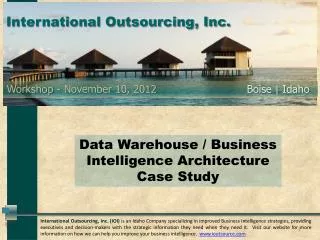
BI Architecture Source: http://www.rpi.edu/datawarehouse/docs/DW-Architecture.pdf
Key Concepts in BI Development Lifecycle Technology Data Application
OLTP Versus Business Intelligence: Who asks what? OLTP Questions When did that order ship? How many units are in inventory? Does this customer haveunpaid bills? Are any of customer X’s line items on backorder? Analysis Questions What factors affect order processing time? How did each product line (or product) contribute to profit last quarter? Which products have the lowest Gross Margin? What is the value of items on backorder, and is it trending up or downover time?
OLTP Versus OLAP OLTP Questions When did that order ship? How many units are in inventory? Does this customer haveunpaid bills? Are any of customer X’s line items on backorder? OLAP Questions What factors affect order processing time? How did each product line (or product) contribute to profit last quarter? Which products have the lowest Gross Margin? What is the value of items on backorder, and is it trending up or down over time?
Dimensional Design Process • Select the business process to model • Declare the grain of the business process/data in the fact table • Choose the dimensions that apply to each fact table row • Identify the numeric facts that will populate each fact table row Business Requirements Data Realities
Star Schema Source: Moody and Kortink, "From ER Models to Dimensional Models: Bridging the Gap between OLTP and OLAP Design, Part I," Business Intelligence Journal, Summer 2003, pp. 7-24.
Identifying Measures and Dimensions Performance Measures for KPI Performance Drivers Measures Dimensions • The attribute varies • continuously: • Balance • Unit Sold • Cost • Sales • The attribute is perceived as • a constant or discrete value: • Description • Location • Color • Size
Facts Table Measurements of business events. Dimensions Measures The Fact Table contains keys and units of measure
Fact Tables Fact tables have the following characteristics: • Contain numeric measures (metric) of the business • May contain summarized (aggregated) data • May contain date-stamped data • Are typically additive • Have key value that is typically a concatenated key composed of the primary keys of the dimensions • Joined to dimension tables through foreign keys that reference primary keys in the dimension tables
Store Dimension • It is not uncommon to represent multiple hierarchies in a dimension table. Ideally, the attribute names and values should be unique across the multiple hierarchies.
Inside a Dimension Table • Dimension table key: Uniquely identify each row. Use surrogate key (integer). • Table is wide: A table may have many attributes (columns). • Textual attributes. Descriptive attributes in string format. No numerical values for calculation. • Attributes not directly related: E.g., product color and product package size. No transitive dependency. • Not normalized (star schemar). • Drilling down and rolling up along a dimension. • One or more hierarchy within a dimension. • Fewer number of records.
Product Dimension • SKU: Stock Keeping Unit • Hierarchy: • Department Category Subcategory Brand Product
Operations in Multidimensional Data Model • Aggregation (roll-up) • dimension reduction: e.g., total sales by city • summarization over aggregate hierarchy: e.g., total sales by city and year -> total sales by region and by year • Selection (slice) defines a subcube • e.g., sales where city = Palo Alto and date = 1/15/96 • Navigation to detailed data (drill-down) • e.g., (sales - expense) by city, top 3% of cities by average income • Visualization Operations (e.g., Pivot)
Drilling down in a data mart is nothing more than adding row headers from the dimension tables. Drilling up is removing row headers. We can drill down or up on attributes from more than one explicit hierarchy and with attributes that are part of no hierarchy.
Avoid Null Key in the Fact Table • Include a row in the corresponding dimension table to identify that the dimension is not applicable to the measurent. 11: No Promotion Sales Fact Table
Dragging and dropping dimensional attributes and facts into a simple report
ETL ETL = Extract, Transform, Load • Moving data from production systems to DW • Checking data integrity • Assigning surrogate key values • Collecting data from disparate systems • Reorganizing data
Building The Warehouse Transforming Data
Use of Data Mining • Customer profiling • Market segmentation • Buying pattern affinities • Database marketing • Credit scoring and risk analysis
OLAP and Data Mining Address Different Types of Questions While reporting and OLAP are informative about past facts, only data mining can help you predict the future of your business. Source: http://www.dmreview.com/editorial/dmreview/print_action.cfm?articleId=2367
UA’s Existing Data Warehouse Balanced Scorecard Improve Stakeholder Value Financial Perspective Stakeholder Value ROCE Revenue Growth Strategy Productivity Strategy Build the Franchise Increase Customer Value Improve Cost Structure Improve Asset Utilization • New Revenue Services • Profitability • Cost per Unit • Asset Utilization • Customer Retention • Customer Profitability • Customer Acquisition Product Leadership Customer Intimacy Customer Perspective Customer Value Proposition Operational Excellence Product/Service Attributes Relationship Image Price Quality Time Function Service Relations Brand • Customer Satisfaction “Build the Franchise” “Increase Customer Value” “Achieve Operational Excellence” “Become a Good Neighbor” Internal Perspective (Customer Management Processes) (Innovation Processes) (Operations & Logistics Processes) (Regulatory & Environmental Processes) Learning & Growth Perspective A Motivated and Prepared Workforce Strategic Competencies Strategic Technologies Climate for Action