Download
1 / 25
250 likes | 377 Views
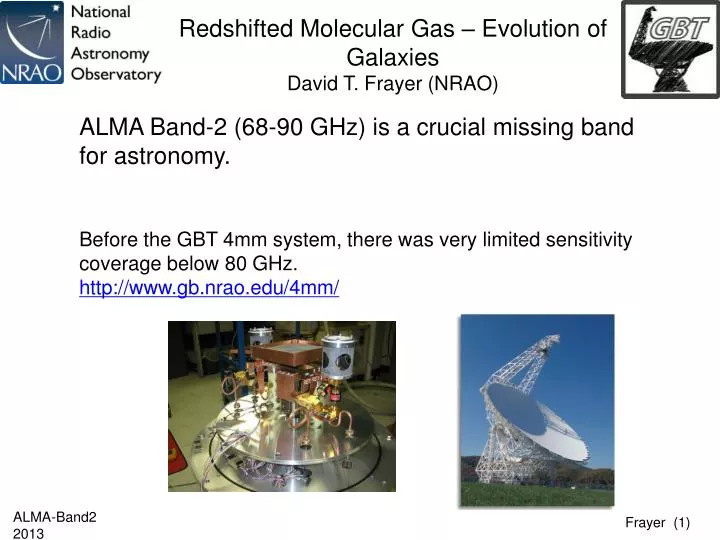
Redshifted Molecular Gas – Evolution of Galaxies David T. Frayer (NRAO). ALMA Band-2 (68-90 GHz) is a crucial missing band for astronomy. Before the GBT 4mm system, there was very limited sensitivity coverage below 80 GHz. http://www.gb.nrao.edu/4mm/. ALMA Band-2 (4mm Rx) “ Key Science ”.

E N D
Redshifted Molecular Gas – Evolution of GalaxiesDavid T. Frayer (NRAO) ALMA Band-2 (68-90 GHz) is a crucial missing band for astronomy. Before the GBT 4mm system, there was very limited sensitivity coverage below 80 GHz. http://www.gb.nrao.edu/4mm/
ALMA Band-2 (4mm Rx) “Key Science” • Fundamental Physics – With VLBI, probe the physics near the base of black hole jets in nearby galaxies {and measure the size of the galaxy via parallax of SagA*}. • The Context of Star Formation – Deuterium species and dense gas tracers key for studies of cold cloud cores from which stars form. • Origin of Life – Complex organic molecules and pre-biotic molecules in the ISM and comets which are key for studying the conditions from which life eventually forms (unexplored frequencies --- lots of discovery potential in astro/bio-chemistry). • Galaxies Across Cosmic Time – CO(1-0) at intermediate redshifts where the evolution of galaxies is proceeding rapidly and dense gas tracers, such as HCN and HCO+, in local star-forming galaxies. From the GBT 4mm Science Case
What are the Bright Extragalactic Lines? FCRAO RSR: NGC253+M82 ALMA Band-2 (67-90 GHz) Line Redshift Range 12CO: 0.28<z<0.72 13CO: 0.2<z<0.64 HCN: 0<z<0.32 HCO+: 0<z<0.33 Intermediate redshift galaxies and (1-0) transitions are important for understanding galaxy evolution
Star-Formation History from the Infrared Why are LIRGs important? The bulk of the infrared EBL is at z~1, and the rapid evolution from now to z~1 is associated luminous infrared star-forming galaxies (LIRGs). Herschel and Spitzer Surveys found large numbers of z~0.2-1 LIRGS. CO at intermediate redshifts key. LIRGs ULIRGs Magnelli, et al. 2009 (Spitzer FIDEL-70um result)
HST imaging of local IRAS LIRGs (part of GOALS sample – Great Observatories All-sky LIRG Survey) What are LIRGs? -- Diverse systems of mergers and disks
GBT/Zpectrometer CO(1-0) Why CO(1-0)? GBT/Zpectrometer CO(1-0) and CARMA/PdBI CO(3-2) observations of Herschel SMGs show wide range of L’[CO](3-2/1-0) ratios of ~0.6+/-0.4 Need 1-0 line for molecular mass measurements. H-ATLAS SDP.81(ON)+SDP.130 (REF, negative): CO(1-0) redshifts measured. (Frayer et al. 2011)
VLA CO(1-0) Imaging SMGs (Ivison et al. 2010): Why do we need spatial resolution? BzKs (Aravena et al. 2010) Observations suggest low-CO excitation for both the BzK’s and SMG samples extended cold CO(1-0)? Imaging: Extended emission or separated clumps, outflows, disks, structure/kinematics ALMA
Comparison of ALMA,VLA, and the GBT for redshifted CO(1-0) Detection levels for same amount of observing time Plot made in Aug 2012, before GBT 4mm upgrade
Evolution Disks vs “Merger” Starbursts Daddi et al. 2010b BzK’s and Tacconi et al. 2010 disk selected sample compared with the SMGs. With CO(1-0) at intermediate redshift, ALMA-Band-2 can study the molecular mass evolution of the “disk sequence” in the transition epoch between z~0--1.
Dense Gas in Local Galaxies Gao & Solomon 2004: Dense gas traced by HCN better correlated with Lir than CO. SFE correlated with dense gas fraction. HCN & HCO+
Significant HCO+/HCN variations in starbursts and AGN sources, although tracing similar densities. Kripps et al. 2008
ALMA mapping CO, HCN, HCO+ • (HCN & HCO+)/CO measures dense gas fraction, star-formation efficiency • HCN/CO strong enhancements AGN, extremely compact IR sources (x-ray heating, IR pumping) • HCO+/HCN ratio enhanced in star-forming regions (UV-field, SN shocks)
Local example: VV114 merger system shows molecular gas and dust that peaks between the two main optical components. The mid-IR emission peaks on the extremely red J-K source in VV114 East Frayer et al. 1999
HCO+ peaks on the star-forming regions with the CO and dust between VV114E&W, while HCN peaks on the strong mid-IR/extremely red VV114E component Imanishi et al. 2007
Variations of Molecular Lines in Nearby Galaxies, e.g. IC342 Meier & Turner 2005 IC342: CO=green, HI=red
16 element scalable W-band FPA for the GBT Argus is scheduled to be deployed at the GBT by November 2014 and is a collaboration between Stanford U. (PI Sarah Church), Caltech, JPL, Univ. Maryland, Univ. Miami, and NRAO. Frequency operation range: 75-115.3 GHz Tsys~75K
GBT vs ALMA Sensitivity: Estimated Observing Times Interferometers provide high-resolution data and good point-source sensitivity (mJy/beam), but lack sensitivity to extended emission (mK).
CASA Simulations to compare GBT vs ALMA+ACA+ALMA_TP 30dor 8um IRAC image – Rescaled from 2” pixels to 1” pixels. 30dor in the LMC is the most luminous star-formation region in the local group of galaxies.
GBT simulated HCN image: Total flux: 1.25 Jy Contours are (0.05, 0.1, 0.2, 0.4, 0.6, 0.8) x peak.
ALMA 5”image (50x12m dishes, full ALMA) Flux: 0.084 Jy (7% of total flux) Contours (-0.1, -0.05, 0.05, 0.1, 0.2, 0.4, 0.6, 0.8)xpeak
ALMA in Total-Power Mode (4x12m dishes OTF maps) Note the lack of spatial information…. Not very useful for combining with data taken with ALMA’s resolution.
ACA image: (9x7m dishes) Shorter spacing recovers more of the emission. Flux= 0.40 Jy (32% of total flux)
ACA+TP image: Flux=1.16Jy (93% of total flux) Note that TP adds significant flux outside of the known emission regions.
Comparisons of simulations of the 30Dor region (10” resolution). GBT Above: ALMA using ACA+TP for clean model does well for bright central regions, but has edge effects and misses extended emission. Above: ALMA “feathered” with ACA+TP adds in extended emission throughout the map and does not do as good as job with bright central region.
Concluding Remarks • ALMA Band-2 Extragalactic Science: • Galaxy evolution via CO(1-0) at intermediate/low redshifts • Dense gas (HCN & HCO+) and molecular variations in nearby and redshifted starbursts • Technical synergies of 67—116 GHz (ALMA Band-2+3 and GBT W-FPA development) • GBT W-FPA could provide useful short-space data for ALMA images of extended sources