Download
1 / 15
150 likes | 269 Views
HPCToolkit Evaluation Report . Hans Sherburne, Adam Leko UPC Group HCS Research Laboratory University of Florida. Color encoding key: Blue: Information Red: Negative note Green: Positive note. Basic Information. Name: HPCToolkit Developer: Rice University Current versions:

E N D
HPCToolkit Evaluation Report Hans Sherburne, Adam Leko UPC Group HCS Research Laboratory University of Florida Color encoding key: Blue: Information Red: Negative note Green: Positive note
Basic Information • Name: HPCToolkit • Developer: Rice University • Current versions: • HPCView: • Website: • http://www.hipersoft.rice.edu/hpctoolkit/ • Contact: • John Mellor-Crummey (johnmc@cs.rice.edu) • Rob Fowler (rjf@cs.rice.edu)
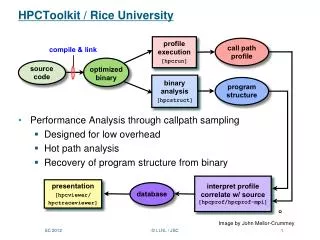
HPCToolkit Overview • HPCToolkit - A suite of tools that aid the programmer in collecting, organizing, and displaying profile data • Consists of • hpcviewer • Sorts by any collected metric, from any processes displayed • Displays samples at various levels in call hierarchy through “flattening” • Allows user to focus in on interesting sections of the program through “zooming” • hpcquick • Simplifies process by integrating hpcprof and hpcview • hpcview • Creates “browsable” performance databases in html, or for use in hpcviewer • bloop • Relate samples to loops, even if significant changes have been made by optimization • hpcprof • Relates samples to source lines • hpcrun • collects profiles by sampling hardware performance counters
Available Metrics in HPCToolkit • Metrics, obtained by sampling/profiling • PAPI Hardware counters • Any other source for data profiles that can output data in “profile-like input format” (not tested) • Wallclock time (WALLCLK) • However, can’t get PAPI metrics and Wallclock time in a single run • Derived metrics • Combination of existing metrics created by specifying a mathematical formula in an XML configuration file. • Source Code Correlation • Metrics reflect exclusive time spent in function based on counter overflow events • Metrics correlated at the source line level and the loop level • Metrics are related back to source code loops (even if code has been significantly altered by optimization) (“bloop”)
Testing Notes • Used LAM instead of mpich for testing • When MPICH mpirun used with hpcrun, hpcrun complains about a “– p” option, even though it was not given • Needed to reduce size of message in big-message.c because of LAM • Unable to get NBP - LU to run using LAM • Major stumbling blocks of hpctoolkit bottleneck identification • Since profile data is not related back to the callsite in the user’s code, but rather the actual function, it is difficult to determine where in the user’s code the problem lies • Profiling recording wallclock time was glitchy, some profiles contained very little useful information
HPCToolkit Overhead • All programs executed correctly when instrumented • < 20 % overhead on all benchmarks when recording just PAPI_TOT_CYC (default option)
Bottleneck Identification Test Suite • Testing metric: what did profile data tell us? • CAMEL: TOSS-UP • Profile showed work equally distributed across the processes • Unable to determine communication costs from PAPI hardware counters • NAS LU: NOT TESTED • Unable to get LU benchmark to run successfully using LAM • needed to use LAM because could not get MPICH to work with hpcrun • Big message: TOSS-UP • Profiling wallclock time didn’t produce a profile with information in it • Cycle count is misleading and doesn’t reveal time spent in communication
Bottleneck Identification Test Suite (2) • Diffuse procedure: PASSED • Profile showed large amount of time spent in bottleneck procedure • Time is diffused across processes • Hot procedure: PASSED • Profile showed large amount of time spent in bottleneck procedure • Intensive server: TOSS-UP • Profile showed large amount of time spent in waste_time on on one process • The other processes show time spent in functions outside of user code, which is difficult to use for bottleneck identification • Ping pong: TOSS-UP • From profile it’s clear that within user code, the time is spent in two different loops • Profile shows time spent in functions outside of user code, which is difficult to use for bottleneck identification • Random barrier: TOSS-UP • Profile shows lots of time spent in waste_time • Profile does not show communication pattern amongst processes • Small messages: TOSS-UP • Profile reveals only one process spends time in Grecv_messages • Profile shows time spent in functions outside of user code, which is difficult to use for bottleneck identification • System time: TOSS-UP • Profile show lots of time spent in kill and execlp • It’s difficult to relate this information back to the call site in waste-time • Wrong way: FAIL • Profile does not show communication pattern amongst processes • Profile shows time spent in functions outside of user code, which is difficult to use for bottleneck identification
General Comments • Good notes • The components of HPCToolkit work well for sequential code. • Have access to available (native event) PAPI counters on the system. • Can derive new metrics from sampled metrics using hpcview • Data is correlated with source code • Things that could use improvement • Only simple display of profiled metrics and source code correlation is provided • Whether a metric should be created, hidden, or shown in hpcviewer must be specified before it is run • Collection of multiple metrics may require multiple runs • Parallel code may be difficult to analyze • Different methods for launching parallel programs achieve varying levels of ease and usefulness with hpcrun • Requires that line mapping information be present in all executables/libraries to be analyzed (“-g” option in many compilers) • The ability to display inclusive time spent at callsites in user code, rather than exclusive time spent in all (library) functions, would increase the usefulness of the tool tremendously
Evaluation (1) • Available metrics: 2/5 • Uses hardware counters only (PAPI) • New metrics can be derived from existing ones • No statistics regarding communication are provided • Cost: 5/5 • HPCToolkit is freely available • Documentation quality: 2.5/5 • Documentation is in the form of a ppt presentation, and man pages • One comprehensive user manual would be helpful • Extensibility: 3.5/5 • HPCToolkit source code is freely available • No tracing support • Very good source code correlation • Requires the use of PAPI for hpcrun (profile creation) • Filtering and aggregation: 3.25/5 • User can add and hide columns • Filtering requires manual editing and can only be done on a per-node basis
Evaluation (2) • Hardware support: 2/5 • 64-bit Linux (Opteron and Itanium) w/PAPI, IRIX, AlphaServer (Tru64) • Heterogeneity support: 0/5 (not supported) • Installation:4/5 • Installation on Linux platform not bad • Requires PAPI to be installed • Interoperability: 3/5 • Profile data stored in XML format • Works with SGI’s ssrun and Compaq’s uprofile • Learning curve: 3.5/5 • The interface is fairly intuitive, but takes some use to get comfortable with the notion of “flattening” • The separation of the tools for platform support causes increase user overhead • Manual overhead: 4/5 • Default instrumentation (only option available) has the same effect as instrumenting all functions, loops, MPI calls, and function calls • It is fairly straightforward to measure at the source line and loop level • It is not possible to turn on and off sampling for selected parts of the source code • Specifying derived functions in XML is awkward • Measurement accuracy: 2/5 • CAMEL overhead: 17% • Overhead is less than 20% when recording a single PAPI hardware counter
Evaluation (3) • Multiple executions: 3/5 • Comparison of metrics from multiple runs is possible • There is not built-in scalability or optimization comparison, but one can be created using MathML expressions • Multiple analyses & views: 2/5 • A single view of profile data correlated with source code is provided • Only profile data (not trace data) is viewable • Comparison and ordering of hardware counter values is the only form of analysis • Performance bottleneck identification: 1/5 • All metrics can be sorted in increasing or decreasing order • “Flattening” approach increases ease of comparison some • Bottleneck identification requires significant user insight when selecting which hardware counters to use, and in locating points for improvement • MPI time sometimes not attributed to MPI callsites (instead was attributed to internal LAM MPI routines) • Seems better suited to sequential programs • Profiling/tracing support: 2.5/5 • Only profiling is supported • Hardware counters must be used • Profiling is done on source line, and loop level • Communication profiling is not available • Data from routines inside third-party libraries can be recorded
Evaluation (4) • Response time: 2.5/5 • Data is not available in HPCToolkit until after execution completes and performance data is processed • Searching: 0/5 (not supported) • Software support: 4/5 • Supports sequential and parallel programs • Difficulty running with MPICH, though it is mentioned in tutorial presentation • Profile information will show up for all binaries with debugging information present • Source code correlation: 5/5 • Source code correlation of profile data is the main view offered • System stability: 4/5 • Hpcviewer works well • Did not work well with MPICH • Technical support: 4/5 • Received timely & helpful response from developers
References • 1. HPCToolkit website • http://www.hipersoft.rice.edu/hpctoolkit/ • 2. HPCToolkit SC Tutorial Presenation • http://www.hipersoft.rice.edu/hpctoolkit/sc04/index.html