Download
1 / 23
290 likes | 960 Views
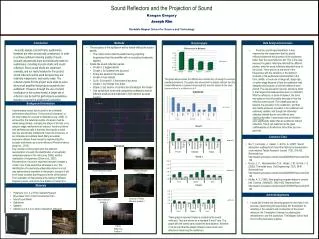
Sound Reflectors and the Projection of Sound. Kaegan Gregory. Overview of Prior Research. Every concert hall is unbalanced Acoustic engineers adjust acoustics in concert halls Sound shells Sound Reflectors RCHS auditorium adjusted with sound reflectors

E N D
Sound Reflectors and the Projection of Sound Kaegan Gregory
Overview of Prior Research • Every concert hall is unbalanced • Acoustic engineers adjust acoustics in concert halls • Sound shells • Sound Reflectors • RCHS auditorium adjusted with sound reflectors • Tested low, middle, and high frequencies
Procedure • Test acoustics • Low medium high frequencies • 9 points in auditorium • Develop wooden sound reflectors • test, and revise positions • Develop plastic sound reflectors • test, revise positions • Analyze data • Standard deviation of low medium high frequencies, this value is then plugged into ANOVA
Data: Control • Auditorium proved to be unbalanced • Seemingly random data • Odd acoustic trend • Average decibel level: 74.9 (average throughout auditorium) • Data was expected
Data: Wooden Reflector (pos. 1) • Balance improved • Still abnormalities in hot spots in auditorium, requiring further adjustment • Data makes sense based on angles • Projected sound throughout auditorium • Average decibel level: 78
Graph of standard deviation of trials between left, center, and right
Data: Wooden Reflector (pos. 2) • Balance further improved • Angles of reflection adjusted • Average decibel level: 77.5
Graph of standard deviation of trials between left, center, and right
Data: Plastic Reflector • Balance improved to a standard deviation of 1.36 (60% improvement from original) • Average decibel level: 76
Graph of standard deviation of trials between left, center, and right
Analysis • When all trials are compared, no significant differences. (p=.071) • When control was compared to any trial, there were significant differences (p=.011) • Shows that adjustments caused sound to be reflected almost certainly not by chance
What Does This Mean?? • The sound reflectors proved to be a practical solution for the RCHS auditorium • Hot spots nearly eliminated • more sound projected • Materials fairly inexpensive • Implementation • Beta testing (band/chorus) • Design improvement • Scaled enlargement • Suspension?
Music • Associate principal flute ASYO • Associate principal flute ESYO • 4th flute AYWS • 7th chair Allstate band
Honors • Governor’s Honors Program (flute/dance) • Music Theory Classes • History of Music classes • Solo and orchestral performances • Choreography techniques • Modern, Jazz, MOJA, and Ballet
Movement • Founding member of Omni Free Running • Flow • Parkour • Tricking • Free Running • Tumbling