Download
1 / 36
360 likes | 508 Views
The Winter 2011-2012 Winter Recap and Spring Outlook. Jason Hansford Senior Forecaster National Weather Service Forecast Office Shreveport, LA. December Rainfall. Departure From Normal. December Observed Rainfall. 2011 Total Precipitation. December-March Rainfall .

E N D
The Winter 2011-2012 Winter Recap and Spring Outlook Jason Hansford Senior Forecaster National Weather Service Forecast Office Shreveport, LA
December Rainfall Departure From Normal December Observed Rainfall
December-March Rainfall Departure From Normal 90 Day Observed Rainfall
April Rainfall (Ending 4/16/12) Departure From Normal Observed Rainfall
March Flooding • Significant rainfall (widespread 4-8 inches, isolated amounts > 10-12 inches) area wide. • Drought has been eliminated across most areas. March Month to Date Rainfall: Departure from Normal:
Hydrological Drought Impacts Cane River in Natchitoches, LA Taken 3/21/12 around 10 am (Photo courtesy of Wiley Butler) Cane River in Natchitoches, LA Measured near 2 ft. on 10/11/11 (Photo courtesy of Wiley Butler)
Hydrological Drought Impacts Cane River in Natchitoches, LA March 21st, 2012 (Photo courtesy of Wiley Butler) Cane River in Natchitoches, LA June 17th, 2011 (Photo courtesy of Wiley Butler)
Calculated Soil Moisture(Ending March 24, 2012) Soil Moisture has INCREASED to 500-600 mm (20-24 in.) deep! Soil Moisture has returned to near/slightly above normal!
Drought Severity Indices • Palmer Drought Severity Index: Is most effective in determining long termdrought by using temperature and precipitation to calculate dryness. It is also standardized to the local climate. • Measured on a scale of -4 to 4, with negative values indicating drought, and positive values indicating moisture surplus. • Crop Moisture Index (CMI): Is a short term drought index, based on precipitation, dryness, and wetness affecting agriculture. It changes more rapidly from week to week than the Palmer Index. • Uses the same scale as the Palmer Index.
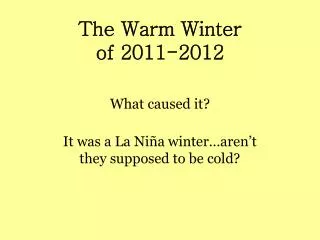
Winter Temperature Comparison (“The Winter That Wasn’t”) *Tied for 8th warmest winter on record with 1997. Sporadic records since 1895. **Tied for 10th warmest winter on record with 2000. Records since 1906.
Month by Month TemperatureComparison for Shreveport, LA(Nov. 2011 – April 15th, 2012)
Arctic Oscillation • Refers to the atmospheric circulation pattern in the northern middle and high latitudes in the Arctic. These can generate strong shifts in the climate pattern than can overwhelm or amplify the typical La Niña impacts. • Exhibits a negative phase when higher pressures develop over the Polar region, and low pressures develop in the mid- latitudes (near 45°N). This results in frigid air plunging south into North America east of the Rockies. • Exhibits a positive phase when lower pressures develop over the Polar region, and higher pressures develop in the mid- latitudes. This will keep the frigid air locked up in the Arctic region, but also drives ocean storms farther north. Thus, wetter weather is usually associated throughout Alaska, Scotland, and Scandinavia.
Arctic Oscillation (Nov. – Mar. 1950 - Current) Limitations to Forecasting: Strong AO episodes typically last only a few weeks, and are difficult to predict more than a week or two in advance.
North Atlantic Oscillation • Fluctuations in the difference of sea-level pressure between the Icelandic Low and the Azores high. • + NAO prevents cold air from plunging southward over eastern North America. • Shows multi-decadal signal. • Has an effect on Hurricanes in the Atlantic. (During +NAO events, the Bermuda High is weaker, allowing for a more W-E flow across the Atlantic. SST’s in the Atlantic are also unusually cold following +NAO winters.)
Historical NAO Index Strong positive anomalies this past winter. Strong negative anomalies last winter.
Monthly Observed Arctic and North Atlantic Oscillation Indices
SST’s in the Equatorial Pacific Niño 3.4 Region: 5°N - 5°S and 170° - 120°W [ ] [ ]
La Nina is Ending! So, What’s Next?! Niño 3.4 SST’s Model Forecasts
Spring Outlook Temperature Precipitation
The End Any Questions???