Download
1 / 23
230 likes | 314 Views
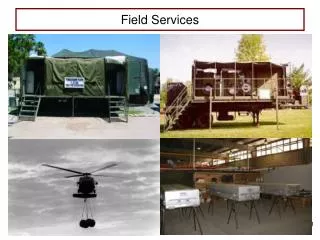
Network Field Services. Capacity Constraints in NFS. Content. Introduction Scope Modelling the numbers Impact of Top 200 Gold, Silver and Bronze exchanges Areas of capacity shortage and surplus Proposed process Criteria. Introduction.

E N D
Network Field Services Capacity Constraints in NFS
Content Introduction Scope Modelling the numbers Impact of Top 200 Gold, Silver and Bronze exchanges Areas of capacity shortage and surplus Proposed process Criteria
Introduction NFS goes through a yearly cycle where work goes into backlog during summer months, particularly in Gauteng Central and NER Regions and to a lesser extent in the Eastern Region This situation has the effect that the KPI`s and the customer service severely deteriorate during this period. The backlog also has the effect that work carried into the new financial year jeopardizes the performance for the New Year right from the start of that year.
Scope This presentation does not take into account the fact that approximately 90% of TSA Revenue is generated from 600 exchanges out of 19319 exchanges. We can however say that the requirement to move staff into critical areas is an immediate need. We do experience staff shortages in most of the 600 exchanges, particularly in Gauteng Central
Modelling numbers A staff model for Commodity Services has been developed that proved to be invaluable in predicting the load and backlogs against time
Modelling numbers continues It is clear that once we worked the backlog down on orders we were very successful in keeping it under control
ADSL Broadband, our flagship commodity product, is lagging the overall commodity performance
The graph above is a depiction of surplus/shortages of technicians after the intake was allocated to technicians and the effect this has on the backlog
??? No markings on previous slide In area marked 1, we are more than 200 TO`s short to deal with daily intake In are marked 2, we have surplus of staff to deal with daily intake Marked 3 – backlog worked down and there is a surplus of TO Area 4 indicates the forecast for the rest of the financial year
Impact of Gold, Silver & Bronze exchange • Top 40 gold exchanges are serviced by 25 NFS CSC • 19 of these CSC are understaffed • 4 correctly staffed • 2 overstaffed • These shortages were calculated after redeployment of 42 staff and the appointment of 50 students in GCR
Nationally the backlog situation is under control except for 4/5 areas as can be seen from the ADSL chart below for 2012/01/31
The areas that show large numbers of DSL faults outstanding are LAU`s 44, 43, 45, 31 and 24 These areas correspond highly with the Gold, Silver and Bronze areas i.e. high revenue generating exchanges For NFS to improve service in these areas we need to move in staff into as a matter of urgency
Modelling numbers continues As seen from the backlog graph above for Gauteng Central in W1 which is the first week in April we started with a backlog of faults of approximately 14000. All the assurance orders will have missed the ITF KPI already. With existing staffing models it took until week 19 to start achieving the Assurance index week for Gauteng Central
Areas of Capacity Shortage and Surpluses Areas of surplus and shortage change during the year depending on the load situation Areas consistently short of staff are LAU 31, 43, 44, 45 and 24
Process • Based on the numbers above:- • Forced rebalance • Firstly rebalance within then region • Secondly rebalance to Gauteng / outside the region • Relocation / transfer will be as per company policy
Criteria Productive Employees Employees with clean records (discipline) Good attendance record Living the CHART values Trainable Employees Employees below the age of 40
Recommendation • TO’s need to move to: • provide excellent service in high revenue exchanges • stop the decline in our customer base • Stem the decline in fixed line revenue