Download
1 / 21
210 likes | 483 Views
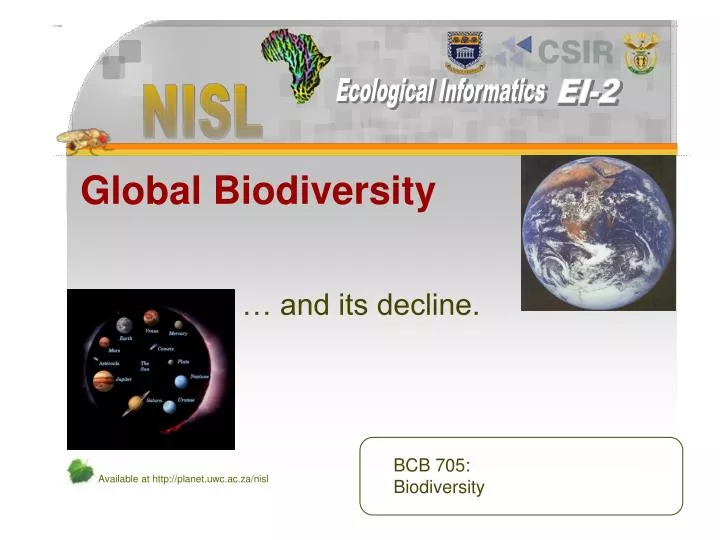
Global Biodiversity. … and its decline. BCB 705: Biodiversity. Oh Dear!. No one knows how much biodiversity there is or how much will be lost. The multiple levels of biodiversity mean that no single measurement for biodiversity is possible.

E N D
Global Biodiversity … and its decline. BCB 705: Biodiversity
Oh Dear! • No one knows how much biodiversity there is or how much will be lost. • The multiple levels of biodiversity mean that no single measurement for biodiversity is possible. • This chapter briefly considers measures of ecosystem and genetic diversity before concentrating on the species inventory and estimates of global species numbers and species extinction rates. • The present species inventory contains the 1.4—1.8 million species already described but does not contain much information about most of these species.
Biodiversity at the Ecosystem Level • It is difficult to set boundaries for an ecosystem. • There is no standard classification system for ecosystems. • Ecosystems are usually classified at two levels: • Globally • Locally/regionally. • Existing global classifications are inadequate. • Global ecosystem classification is of little value at the scales that are important for conservation. • Remote sensing provides ways to assess and monitor vegetation structure and phenology – aspects of ecosystems.
Biodiversity at the Genetic Level • Genetic diversity may be considered/compared at three levels : • Variability between individuals within a population, • Variability between populations within a species, • Diversity between species. • Heterozygosity is used to quantify the first two levels listed above. Comparisons of heterozygosity between species do not quantify how different the species are, merely how different their internal variability is. • The proportion of heterozygosity depends on: • The evolutionary rates of the proteins or DNA used to measure the variability, • The breeding system of the organism, • The degree of connectivity between the populations.
Problems with the Existing Species Inventory (1) • The precise number of recognized species is not known. • The lack of a single definition for a species. • It contains poor taxonomy as well as sound taxonomy. • Synonymy • No recognized central register of species. • Holotype (“type”) specimens are difficult to access. • The natural variation of a species is unknown – different forms may be given different names. • Determining the number of recognized species at any time is not given priority.
Problems with the Existing Species Inventory (2) • The existing partial inventory is biased towards: • Species that appeal to humans, • Pests, • Organisms not requiring complex procedures or expensive equipment to study, • Larger size, • Easily distinguishable species that are readily sorted, • Species that are easily accessed.
Gaps in the Species Inventory • Soil organisms • Tropical forest canopies • Marine benthic organisms • Parasites • Nematodes • Fungi and microorganisms • Terrestrial arthropods
Numbers (in Thousands) of Described Species * Groombridge (1992) lists vertebrates, not all chordates.
Erwin’s Estimate of 30 million Arthropod Species • Erwin (1982) estimated that the global total of arthropod species was as large as 30 million. • Erwin’s ‘data’: • 955+ beetles excluding weevils found in one tree species canopy. • Weevil numbers ≈ leaf-beetles numbers so ~ 206 weevils per tree species. • About 50 000 tropical tree species. • Erwin’s assumptions: • Host specificity about 13.5 % of the total number of beetle species per tree canopy. • Beetles make up 40 % of tropical canopy arthropods. • Forest canopy to forest floor ratio = 2:1 (Erwin added a third of the number of canopy species to the total number of canopy species).
Calculating Erwin’s Estimate • 955 (beetle species – weevil species) + 206 (weevil species) = 1 161 beetle species per tree species canopy. Round up to 1 200 beetle species per tree species canopy. • 13.5 % of 1 200 = 162 host specific beetle species per tree species canopy. 1200 – 162 = 1 038 beetle species that are transient. • 162 host specific beetle species per tree species canopy * 50 000 tropical tree species = 8 100 000 host specific beetle species in the tropical tree canopy. Add 1 038 transient species = 8 101 038 beetle species in the tropical tree canopy. • Beetles = 40 % of arthropods. 8 101 038 / 4 * 10 = 20 252 595 arthropod species in the tropical tree canopy. • Add one third for forest floor arthropods 20 252 595 + 6 683 356 = 26 935 951 tropical forest arthropod species. • Estimate non-tropical arthropod speciesabout 3 100 000 then the global total is ≈ 30 million arthropod species.
More Recent Data and the Impacts on Erwin’s Estimate • Temperate and provisional tropical findings suggest that host specificity is < 5 % (Stork 1997). • Though latitudinal variation in the proportions of species from different guilds of insects is probable, the figures from widely spread studies suggest that beetles make up 20—25 % of the total number of arthropods (Stork 1997). • Raw data from two studies suggest that the canopy to forest floor arthropod species ratio should at least be reversed (1:2 not 2:1). There is also evidence to suggest that a large portion of the fauna will be found in both ecotones (Groombridge 1992, Stork 1997). • 5 % of 1 200 = 60. 1 200 – 60 = 1 140. 60 * 50 000 = 3 000 000.3 001 140 * 4 = 12 004 560. 12 004 560 * 3 = 36 013 680.36 013 680 + 3 100 000 = 39 113 680 arthropod species in the world. • Changing the ratios used by Erwin makes a big impact on the total estimate (39 113 680 vs. 30 000 000).
Problems with Single Sample Extrapolations • All estimates are affected by the accuracy of the figures used. The accuracy/completeness of counts from a single sample is open to question. • Calibration of ratios is generally poor or non-existent. Erwin’s estimate is a case in point. • The assumption that the relationships used in the extrapolation scale evenly is often unstated.
Useful Ratios for Estimation • All extrapolations from existing data involve one or more assumptions. • All ratios need to be calibrated to support the assumption that the ratio holds under different conditions. • Six categories of known to unknown species richness ratios are useful for extrapolation: • Group A to group B • Subgroup to group • Sample to inventory • Area A to area B • Smaller scale to larger scale • Habitat/stratum to inventory.
Other Forms of Estimation • Time-series of species descriptions may be used to estimate future growth within groups of organisms. • The empirical rule that numbers of species increase with decreasing body size may be used to extrapolate for larger organisms but appears to break down at lengths of less than one millimetre. • The proportions of species in the different trophic levels of the food web allow fairly reliable generalization without reference to host specificity. • The data on host specificity is insufficient for reliable estimation. Vegetation structure may yield better predictions of the numbers of parasites than the number of species does. • Specialist opinion depends on exposure to data on especially the richness of poorly studied regions. Specialists’ estimates tend to be conservative.
Global Species Estimates (in Thousands) * Groombridge (1992) lists the vertebrate subset of chordates.
Present vs. Background Extinction Rates • Species life spans and background extinction rates are estimated from the fossil record. • For mammals, a species life span is about one million years and the background extinction rate is about one species every two hundred years. • For organisms with adequate data from the fossil record, the average species life span is between five and ten million years which with a background extinction rate of about one species every thousand years. • The present overall extinction rate is estimated to be about 500 times the background extinction rate. • For birds, the present rate is about 1 000 times the background rate.
Estimating Future Extinction Rates • Two principle forms of estimation of extinction rates exist: • Estimates based on rates of habitat loss and the species-area relationships from island biogeography. • Estimates based on Red Data lists take several forms. • Rates at which species change categories, • Species-by-species assessments, • Relative extinction rates between different taxa to predict the number extinctions.
Problems with Estimates Based on Habitat Loss and Species-Area Relationships • The accuracy of such estimates is low because: • Detailed knowledge of species distribution and endemism is lacking, • Habitat loss is not evenly distributed, • The rate of habitat loss is uncertain, • Changes at a global level are not considered, • Genetic impoverishment is not considered, • The likely survival of species in modified habitats is uncertain, • The pattern of habitat loss is uncertain, • The species-area relationship varies between taxonomic groups, • Past disturbance and habitat loss are unknown, • Changes in future human behaviour are uncertain.
Species Most Threatened with Extinction • Based on ecological theory, species with the following traits are most threatened with extinction: • Large organisms, • Those feeding highest in the food chain, • Those with chronically small population sizes, • Those with small ranges or distributions, • Those linked by biology to threatened habitats or ecosystems, • Those that evolved in isolation (e.g. island organisms), • Those with poor dispersal and colonization abilities, • Those with colonial nesting habits, • Migratory species, • Those dependent on unreliable resources, • Those with little evolutionary experience of disturbances.
Some Cautions • Neither global biodiversity estimates nor estimated extinction rates contribute to either conservation practice or tackling the root causes of biodiversity loss. • Data on extinction rates are optimistic in that genetic impoverishment is not taken into account. • Each species is the potential ancestor of future species so abnormal extinction rates affect future speciation.
Chapter 1 Biodiversity: what is it? Chapter 2 The evolution of biodiversity Chapter 3 Biodiversity: why is it important? Chapter 4 Global biodiversity and its decline Chapter 5 … I hope that you found chapter 4 informative and that you will enjoy chapter 5.