Download
1 / 82
820 likes | 842 Views
Learn about TAU, a performance system framework for parallel computing, with strategies for empirical evaluation and flexible instrumentation techniques. Developed at University of Oregon.

E N D
Tuning and Analysis UtilitiesSameer Shende, Allen D. Malony, Robert BellUniversity of Oregon
Overview • Introduction • Definitions, general problem • Tuning and Analysis Utilities (TAU) • Configuration • Instrumentation • Various levels of instrumentation • Measurement • Analysis • Conclusions
Definitions – Profiling • Profiling • Recording of summary information during execution • execution time, # calls, hardware statistics, … • Reflects performance behavior of program entities • functions, loops, basic blocks • user-defined “semantic” entities • Very good for low-cost performance assessment • Helps to expose performance bottlenecks and hotspots • Implemented through • sampling: periodic OS interrupts or hardware counter traps • instrumentation: direct insertion of measurement code
Definitions – Tracing • Tracing • Recording of information about significant points (events) during program execution • entering/exiting code region (function, loop, block, …) • thread/process interactions (e.g., send/receive message) • Save information in event record • timestamp • CPU identifier, thread identifier • Event type and event-specific information • Event trace is a time-sequenced stream of event records • Can be used to reconstruct dynamic program behavior • Typically requires code instrumentation
Definitions – Instrumentation • Instrumentation • Insertion of extra code (hooks) into program • Source instrumentation • Done by compiler, source-to-source translator, or manually + portable + links back to program code – re-compile is necessary for (change in) instrumentation – requires source to be available – hard to use in standard way for mix-language programs – source-to-source translators hard to develop for C++, F90 • Object code instrumentation • “re-writing” the executable to insert hooks
Definitions – Instrumentation (continued) • Dynamic code instrumentation • a debugger-like instrumentation approach • executable code instrumentation on running program • DynInst [U. Maryland, U. Wisc] and DPCL are examples +/– switch around compared to source instrumentation • Pre-instrumented library • typically used for MPI and PVM program analysis • supported by link-time library interposition + easy to use since only re-linking is necessary – can only record information about library entities
void master { trace(ENTER, 1); ... trace(SEND, B); send(B, tag, buf); ... trace(EXIT, 1); } 1 2 3 master slave ... 60 62 ... 68 69 ... 64 58 A A B A B B RECV EXIT ENTER SEND ENTER EXIT B A 1 2 1 2 void slave { trace(ENTER, 2); ... recv(A, tag, buf); trace(RECV, A); ... trace(EXIT, 2); } Event Tracing: Instrumentation, Monitor, Trace Event definition CPU A: timestamp MONITOR CPU B:
1 2 3 master slave ... 69 ... 60 64 68 58 62 ... A A B B B A EXIT RECV ENTER EXIT ENTER SEND 1 B 2 1 A 2 A 70 68 66 60 62 58 64 Event Tracing: “Timeline” Visualization main master slave B
TAU Performance System Framework • Tuning and Analysis Utilities • Performance system framework for scalable parallel and distributed high-performance computing • Targets a general complex system computation model • nodes / contexts / threads • Multi-level: system / software / parallelism • Measurement and analysis abstraction • Integrated toolkit for performance instrumentation, measurement, analysis, and visualization • Portable, configurable performance profiling/tracing facility • Open software approach • University of Oregon, LANL, FZJ Germany • http://www.cs.uoregon.edu/research/paracomp/tau
Strategies for Empirical Performance Evaluation • Empirical performance evaluation as a series of performance experiments • Experiment trials describing instrumentation and measurement requirements • Where/When/How axes of empirical performance space • where are performance measurements made in program • when is performance instrumentation done • how are performance measurement/instrumentation chosen • Strategies for achieving flexibility and portability goals • Limited performance methods restrict evaluation scope • Non-portable methods force use of different techniques • Integration and combination of strategies
TAU Instrumentation • Flexible instrumentation mechanisms at multiple levels • Source code • manual • automatic using Program Database Toolkit (PDT), OPARI • Object code • pre-instrumented libraries (e.g., MPI using PMPI) • statically linked • dynamically linked (e.g., Virtual machine instrumentation) • fast breakpoints (compiler generated) • Executable code • dynamic instrumentation (pre-execution) using DynInstAPI
TAU Instrumentation (continued) • Targets common measurement interface (TAU API) • Object-based design and implementation • Macro-based, using constructor/destructor techniques • Program units: function, classes, templates, blocks • Uniquely identify functions and templates • name and type signature (name registration) • static object creates performance entry • dynamic object receives static object pointer • runtime type identification for template instantiations • C and Fortran instrumentation variants • Instrumentation and measurement optimization
Multi-Level Instrumentation • Uses multiple instrumentation interfaces • Shares information: cooperation between interfaces • Taps information at multiple levels • Provides selective instrumentation at each level • Targets common measurement interface (TAU API) • Targets a common performance model • Presents a unified view of execution
TAU Measurement • Performance information • High-resolution timer library (real-time / virtual clocks) • General software counter library(user-defined events) • Hardware performance counters • PAPI (Performance API) (UTK, Ptools Consortium) • PCL (Performance Counter Library) (ZAM, Germany) • consistent, portable API • Organization • Node, context, thread levels • Profile groups for collective events (runtime selective) • Performance data mapping between software levels
TAU Measurement (continued) • Parallel profiling • Function-level, block-level, statement-level • Supports user-defined events • TAU parallel profile database • Call path profiles • Hardware counts values (in replace of time) • Tracing • All profile-level events • Interprocess communication events • Timestamp synchronization • User-configurable measurement library (user controlled)
TAU Measurement System Configuration • configure [OPTIONS] • {-c++=<CC>, -cc=<cc>}Specify C++ and C compilers • {-pthread, -sproc} Use pthread or SGI sproc threads • -openmp Use OpenMP threads • -jdk=<dir> Specify Java instrumentation (JDK) • -opari=<dir> Specify location of Opari OpenMP tool • -papi=<dir> Specify location of PAPI • -pdt=<dir> Specify location of PDT • -dyninst=<dir> Specify location of DynInst Package • -mpi[inc/lib]=<dir> Specify MPI library instrumentation • -python[inc/lib]=<dir> Specify Python instrumentation • -epilog=<dir> Specify location of EPILOG
TAU Measurement System Configuration • configure [OPTIONS] • -TRACE Generate binary TAU traces • -PROFILE (default) Generate profiles (summary) • -PROFILECALLPATH Generate call path profiles • -PROFILESTATS Generate std. dev. statistics • -MULTIPLECOUNTERS Use hardware counters + time • -CPUTIME Use usertime+system time • -PAPIWALLCLOCK Use PAPI’s wallclock time • -PAPIVIRTUAL Use PAPI’s process virtual time • -SGITIMERS Use fast IRIX timers • -LINUXTIMERS Use fast x86 Linux timers
Description of Optional Packages • PAPI – Measures hardware performance data e.g., floating point instructions, L1 data cache misses etc. • PCL – Measures hardware performance data • DyninstAPI – Helps instrument an application binary at runtime or rewrites the binary • EPILOG – Trace library. Epilog traces can be analyzed by EXPERT [FZJ], an automated bottleneck detection tool. • Opari – Tool that instruments OpenMP programs • Vampir – Commercial trace visualization tool [Pallas] • Paraver – Trace visualization tool [CEPBA]
TAU Measurement Configuration – Examples • ./configure -c++=xlC_r –pthread • Use TAU with xlC_r and pthread library under AIX • Enable TAU profiling (default) • ./configure -TRACE –PROFILE • Enable both TAU profiling and tracing • ./configure -c++=guidec++ -cc=guidec -papi=/usr/local/packages/papi –openmp -mpiinc=/usr/packages/mpich/include -mpilib=/usr/packages/mpich/lib • Use OpenMP+MPI using KAI's Guide compiler suite and use PAPI for accessing hardware performance counters for measurements • Typically configure multiple measurement libraries
Performance Mapping • Associate performance with “significant” entities (events) • Source code points are important • Functions, regions, control flow events, user events • Execution process and thread entities are important • Some entities are more abstract, harder to measure • Consider callgraph (callpath) profiling • Measure time (metric) along an edge (path) of callgraph • Incident edge gives parent / child view • Edge sequence (path) gives parent / descendant view • Problem: Callpath profiling when callgraph is unknown • Determine callgraph dynamically at runtime • Map performance measurement to dynamic call path state
k-Level Callpath Implementation in TAU • TAU maintains a performance event (routine) callstack • Profiled routine (child) looks in callstack for parent • Previous profiled performance event is the parent • A callpath profile structure created first time parent calls • TAU records parent in a callgraph map for child • String representing k-level callpath used as its key • “a( )=>b( )=>c()” : name for time spent in “c” when called by “b” when “b” is called by “a” • Map returns pointer to callpath profile structure • k-level callpath is profiled using this profiling data • Set environment variable TAU_CALLPATH_DEPTH to depth • Build upon TAU’s performance mapping technology • Measurement is independent of instrumentation • Use –PROFILECALLPATH to configure TAU
TAU Instrumentation Options • Manual instrumentation • TAU Profiling API • Automatic instrumentation approaches • PDT – Source-to-source translation • MPI - Wrapper interposition library • Opari – OpenMP directive rewriting • DyninstAPI – Runtime instrumentation, rewrite binary
Manual Instrumentation – Using TAU • Install TAU % configure ; make clean install • Instrument application • TAU Profiling API • Modify application makefile • include TAU’s stub makefile, modify variables • Set environment variables • directory where profiles/traces are to be stored • Execute application % mpirun –np <procs> a.out; • Analyze performance data • paraprof, vampir, pprof, paraver …
Setup: Running Applications % setenv PROFILEDIR /home/data/experiments/profile/01 % setenv TRACEDIR /home/data/experiments/trace/01(optional) % set path=($path <taudir>/<arch>/bin) % setenv LD_LIBRARY_PATH $LD_LIBRARY_PATH\:<taudir>/<arch>/lib For PAPI (1 counter): % setenv PAPI_EVENT PAPI_FP_INS For PAPI (multiplecounters): % setenv COUNTER1 PAPI_FP_INS (PAPI’s Floating point ins) % setenv COUNTER2 PAPI_L1_DCM (PAPI’s L1 Data cache misses) % setenv COUNTER3 P_VIRTUAL_TIME (PAPI’s virtual time) % setenv COUNTER4 LINUX_TIMERS (Wallclock time) % mpirun –np <n> <application> % llsubmit job.sh For Callpath Profiling: % setenv TAU_CALLPATH_DEPTH 10
TAU Manual Instrumentation API for C/C++ • Initialization and runtime configuration • TAU_PROFILE_INIT(argc, argv);TAU_PROFILE_SET_NODE(myNode);TAU_PROFILE_SET_CONTEXT(myContext);TAU_PROFILE_EXIT(message);TAU_REGISTER_THREAD(); • Function and class methods • TAU_PROFILE(name, type, group); • Template • TAU_TYPE_STRING(variable, type);TAU_PROFILE(name, type, group);CT(variable); • User-defined timing • TAU_PROFILE_TIMER(timer, name, type, group);TAU_PROFILE_START(timer);TAU_PROFILE_STOP(timer);
TAU Measurement API (continued) • User-defined events • TAU_REGISTER_EVENT(variable, event_name);TAU_EVENT(variable, value);TAU_PROFILE_STMT(statement); • Mapping • TAU_MAPPING(statement, key);TAU_MAPPING_OBJECT(funcIdVar);TAU_MAPPING_LINK(funcIdVar, key); • TAU_MAPPING_PROFILE (funcIdVar);TAU_MAPPING_PROFILE_TIMER(timer, funcIdVar);TAU_MAPPING_PROFILE_START(timer);TAU_MAPPING_PROFILE_STOP(timer); • Reporting • TAU_REPORT_STATISTICS();TAU_REPORT_THREAD_STATISTICS();
Manual Instrumentation – C++ Example #include <TAU.h> int main(int argc, char **argv) { TAU_PROFILE(“int main(int, char **)”, “”, TAU_DEFAULT); TAU_PROFILE_INIT(argc, argv); TAU_PROFILE_SET_NODE(0); /* for sequential programs */ foo(); return 0; } int foo(void) { TAU_PROFILE(“int foo(void)”, “ ”, TAU_DEFAULT); // measures entire foo() TAU_PROFILE_TIMER(t, “foo(): for loop”, “[23:45 file.cpp]”, TAU_USER); TAU_PROFILE_START(t); for(int i = 0; i < N ; i++){ work(i); } TAU_PROFILE_STOP(t); // other statements in foo … }
Manual Instrumentation – C Example #include <TAU.h> int main(int argc, char **argv) { TAU_PROFILE_TIMER(tmain, “int main(int, char **)”, “”, TAU_DEFAULT); TAU_PROFILE_INIT(argc, argv); TAU_PROFILE_SET_NODE(0); /* for sequential programs */ TAU_PROFILE_START(tmain); foo(); … TAU_PROFILE_STOP(tmain); return 0; } int foo(void) { TAU_PROFILE_TIMER(t, “foo()”, “ ”, TAU_USER); TAU_PROFILE_START(t); for(int i = 0; i < N ; i++){ work(i); } TAU_PROFILE_STOP(t); }
Manual Instrumentation – F90 Example cc34567 Cubes program – comment line PROGRAM SUM_OF_CUBES integer profiler(2) save profiler INTEGER :: H, T, U call TAU_PROFILE_INIT() call TAU_PROFILE_TIMER(profiler, 'PROGRAM SUM_OF_CUBES') call TAU_PROFILE_START(profiler) call TAU_PROFILE_SET_NODE(0) ! This program prints all 3-digit numbers that ! equal the sum of the cubes of their digits. DO H = 1, 9 DO T = 0, 9 DO U = 0, 9 IF (100*H + 10*T + U == H**3 + T**3 + U**3) THEN PRINT "(3I1)", H, T, U ENDIF END DO END DO END DO call TAU_PROFILE_STOP(profiler) END PROGRAM SUM_OF_CUBES
Instrumenting Multithreaded Applications #include <TAU.h> void * threaded_function(void *data) { TAU_REGISTER_THREAD(); // Before any other TAU calls TAU_PROFILE(“void * threaded_function”, “”, TAU_DEFAULT); work(); } int main(int argc, char **argv) { TAU_PROFILE(“int main(int, char **)”, “”, TAU_DEFAULT); TAU_PROFILE_INIT(argc, argv); TAU_PROFILE_SET_NODE(0); /* for sequential programs */ pthread_attr_t attr; pthread_t tid; pthread_attr_init(&attr); pthread_create(&tid, NULL, threaded_function, NULL); return 0; }
Python Manual Instrumentation Example #!/usr/bin/env/python import pytau From time import sleep x = pytau.profileTimer(``Timer A’’) pytau.start(x) print “ Sleeping for 5 seconds” sleep(5) pytau.stop(x) Running: % setenv PYTHONPATH <tau>/<arch>/lib % ./application.py
Python Automatic Instrumentation Example #!/usr/bin/env/python import tau from time import sleep def f2(): print “ In f2: Sleeping for 2 seconds” sleep(2) def f1(): print “ In f1: Sleeping for 3 seconds” sleep(3) def OurMain(): f1() tau.run(‘OurMain()’) Running: % setenv PYTHONPATH <tau>/<arch>/lib % ./auto.py Instruments OurMain, f1, f2, print, sleep…
CCA Performance Observation Component • Design measurement port and measurement interfaces • Timer • start/stop • set name/type/group • Control • enable/disable groups • Query • get timer names • metrics, counters, dump to disk • Event • user-defined events
CCA C++ (CCAFFEINE) Performance Interface namespace performance { namespace ccaports { class Measurement: public virtual classic::gov::cca::Port { public: virtual ~ Measurement (){} /* Create a Timer interface */ virtual performance::Timer* createTimer(void) = 0; virtual performance::Timer* createTimer(string name) = 0; virtual performance::Timer* createTimer(string name, string type) = 0; virtual performance::Timer* createTimer(string name, string type, string group) = 0; /* Create a Query interface */ virtual performance::Query* createQuery(void) = 0; /* Create a user-defined Event interface */ virtual performance::Event* createEvent(void) = 0; virtual performance::Event* createEvent(string name) = 0; /* Create a Control interface for selectively enabling and disabling * the instrumentation based on groups */ virtual performance::Control* createControl(void) = 0; }; } } Measurement port Measurement interfaces
CCA Timer Interface Declaration • namespace performance { • class Timer { public: virtual ~Timer() {} • /* Implement methods in a derived class to provide functionality */ • /* Start and stop the Timer */ virtual void start(void) = 0; • virtual void stop(void) = 0; /* Set name and type for Timer */ • virtual void setName(string name) = 0; • virtual string getName(void) = 0; virtual void setType(string name) = 0; virtual string getType(void) = 0; • /* Set the group name and group type associated with the Timer */ virtual void setGroupName(string name) = 0; virtual string getGroupName(void) = 0; • virtual void setGroupId(unsigned long group ) = 0; virtual unsigned long getGroupId(void) = 0; }; • } Timer interface methods
Use of Observation Component in CCA Example #include "ports/Measurement_CCA.h"... double MonteCarloIntegrator::integrate(double lowBound, double upBound, int count) { classic::gov::cca::Port * port;double sum = 0.0; // Get Measurement port port = frameworkServices->getPort ("MeasurementPort"); if (port) measurement_m = dynamic_cast < performance::ccaports::Measurement * >(port); if (measurement_m == 0){ cerr << "Connected to something other than a Measurement port"; return -1; } static performance::Timer* t = measurement_m->createTimer( string("IntegrateTimer")); t->start(); for (int i = 0; i < count; i++) { double x = random_m->getRandomNumber (); sum = sum + function_m->evaluate (x); } t->stop(); }
Compiling: TAU Makefiles • Include TAU Stub Makefile (<arch>/lib) in the user’s Makefile. • Variables: • TAU_CXX Specify the C++ compiler used by TAU • TAU_CC, TAU_F90 Specify the C, F90 compilers • TAU_DEFS Defines used by TAU. Add to CFLAGS • TAU_LDFLAGS Linker options. Add to LDFLAGS • TAU_INCLUDE Header files include path. Add to CFLAGS • TAU_LIBS Statically linked TAU library. Add to LIBS • TAU_SHLIBS Dynamically linked TAU library • TAU_MPI_LIBS TAU’s MPI wrapper library for C/C++ • TAU_MPI_FLIBS TAU’s MPI wrapper library for F90 • TAU_FORTRANLIBS Must be linked in with C++ linker for F90. • TAU_DISABLE TAU’s dummy F90 stub library • Note: Not including TAU_DEFS in CFLAGS disables instrumentation in C/C++ programs (TAU_DISABLE for f90).
Including TAU Makefile - Example include /usr/tau/sgi64/lib/Makefile.tau-pthread-kcc CXX = $(TAU_CXX) CC = $(TAU_CC) CFLAGS = $(TAU_DEFS) LIBS = $(TAU_LIBS) OBJS = ... TARGET= a.out TARGET: $(OBJS) $(CXX) $(LDFLAGS) $(OBJS) -o $@ $(LIBS) .cpp.o: $(CC) $(CFLAGS) -c $< -o $@
TAU Instrumentation Options • Manual instrumentation • TAU Profiling API • Automatic instrumentation approaches • PDT – Source-to-source translation • MPI - Wrapper interposition library • Opari – OpenMP directive rewriting • DyninstAPI – Runtime instrumentation, rewrite binary
Program Database Toolkit (PDT) • Program code analysis framework for developing source-based tools • High-level interface to source code information • Integrated toolkit for source code parsing, database creation, and database query • commercial grade front end parsers • portable IL analyzer, database format, and access API • open software approach for tool development • Target and integrate multiple source languages • Use in TAU to build automated performance instrumentation tools
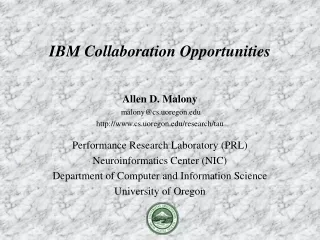
PDT Architecture and Tools C/C++ Fortran 77/90
PDT Components • Language front end • Edison Design Group (EDG): C, C++, Java • Mutek Solutions Ltd.: F77, F90 • Cleanscape FortranLint F95 parser/analyzer (in progress) • creates an intermediate-language (IL) tree • IL Analyzer • processes the intermediate language (IL) tree • creates “program database” (PDB) formatted file • DUCTAPE (Bernd Mohr, ZAM, Germany) • C++ program Database Utilities and Conversion Tools APplication Environment • processes and merges PDB files • C++ library to access the PDB for PDT applications
TAU Makefile for PDT include /usr/tau/include/Makefile CXX = $(TAU_CXX) CC = $(TAU_CC) PDTPARSE = $(PDTDIR)/$(CONFIG_ARCH)/bin/cxxparse TAUINSTR = $(TAUROOT)/$(CONFIG_ARCH)/bin/tau_instrumentor CFLAGS = $(TAU_DEFS) LIBS = $(TAU_LIBS) OBJS = ... TARGET= a.out TARGET: $(OBJS) $(CXX) $(LDFLAGS) $(OBJS) -o $@ $(LIBS) .cpp.o: $(PDTPARSE) $< $(TAUINSTR) $*.pdb $< -o $*.inst.cpp –f select.dat $(CC) $(CFLAGS) -c $*.inst.cpp -o $@
Instrumentation Control • Selection of which performance events to observe • Could depend on scope, type, level of interest • Could depend on instrumentation overhead • How is selection supported in instrumentation system? • No choice • Include / exclude routine and file lists (TAU) • Environment variables • Static vs. dynamic • Problem: Controlling instrumentation of small routines • High relative measurement overhead • Significant intrusion and possible perturbation
Using PDT: tau_instrumentor % tau_instrumentor Usage : tau_instrumentor <pdbfile> <sourcefile> [-o <outputfile>] [-noinline] [-g groupname] [-i headerfile] [-c|-c++|-fortran] [-f <instr_req_file> ] For selective instrumentation, use –f option % cat selective.dat # Selective instrumentation: Specify an exclude/include list. BEGIN_EXCLUDE_LIST void quicksort(int *, int, int) void sort_5elements(int *) void interchange(int *, int *) END_EXCLUDE_LIST # If an include list is specified, the routines in the list will be the only # routines that are instrumented. # To specify an include list (a list of routines that will be instrumented) # remove the leading # to uncomment the following lines #BEGIN_INCLUDE_LIST #int main(int, char **) #int select_ #END_INCLUDE_LIST
Rule-Based Overhead Analysis • Analyze the performance data to determine events with high (relative) overhead performance measurements • Create a select list for excluding those events • Rule grammar (used in tau_reducetool) [GroupName:]Field Operator Number • GroupName indicates rule applies to events in group • Field is a event metric attribute (from profile statistics) • numcalls, numsubs, percent, usec, cumusec, count [PAPI], totalcount, stdev, usecs/call, counts/call • Operator is one of >, <, or = • Number is any number • Compound rules possible using & between simple rules
Example Rules • #Exclude all events that are members of TAU_USER #and use less than 1000 microsecondsTAU_USER:usec < 1000 • #Exclude all events that have less than 100 #microseconds and are called only onceusec < 1000 & numcalls = 1 • #Exclude all events that have less than 1000 usecs per #call OR have a (total inclusive) percent less than 5usecs/call < 1000percent < 5 • Scientific notation can be used • usec>1000 & numcalls>400000 & usecs/call<30 & percent>25
TAU_REDUCE • Reads profile files and rules • Creates selective instrumentation file • Specifies which routines should be excluded from instrumentation rules tau_reduce Selective instrumentation file profile