Download
1 / 1
10 likes | 130 Views
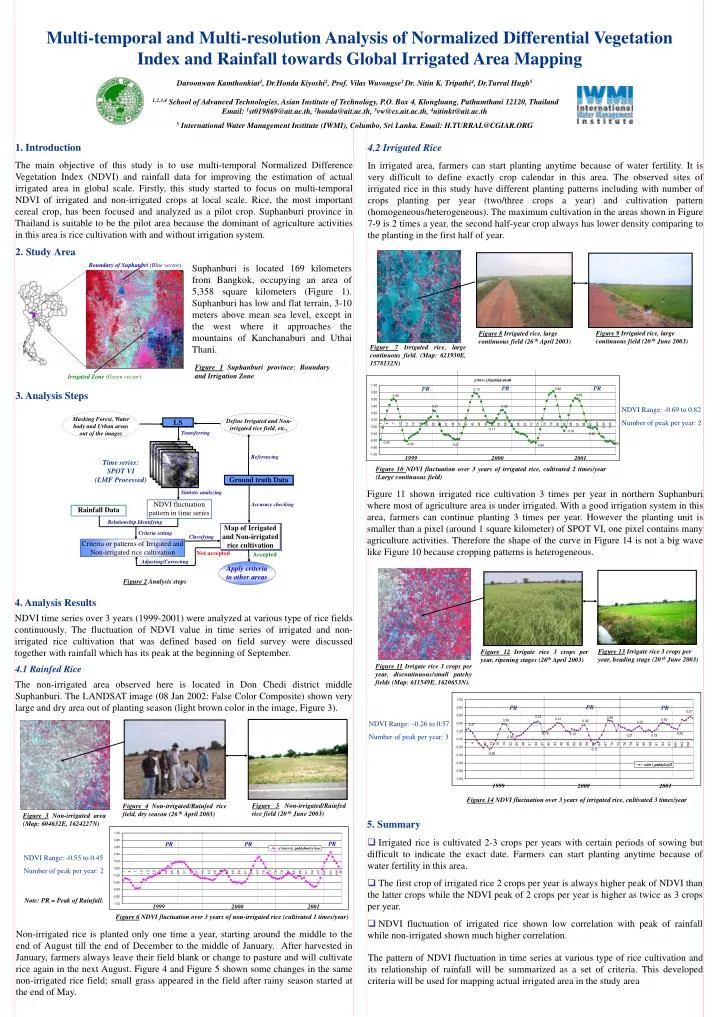
Boundary of Suphanbri (Blue vector). Irrigated Zone (Green vector). Masking Forest, Water body and Urban areas out of the images. Define Irrigated and Non-irrigated rice field, etc.,. LS. Transferring. Referencing. Time series: SPOT VI (LMF Processed). Ground truth Data.

E N D
Boundary of Suphanbri (Blue vector) Irrigated Zone (Green vector) Masking Forest, Water body and Urban areas out of the images Define Irrigated and Non-irrigated rice field, etc., LS Transferring Referencing Time series: SPOT VI (LMF Processed) Ground truth Data Statistic analyzing NDVI fluctuation pattern in time series Accuracy checking Rainfall Data Relationship Identifying Map of Irrigated and Non-irrigated rice cultivation Criteria setting Classifying Criteria or patterns of Irrigated and Non-irrigated rice cultivation Not accepted Accepted Adjusting/Correcting Apply criteria to other areas Figure 2 Analysis steps Multi-temporal and Multi-resolution Analysis of Normalized Differential Vegetation Index and Rainfall towards Global Irrigated Area Mapping Daroonwan Kamthonkiat1, Dr.Honda Kiyoshi2, Prof. Vilas Wuvongse3 Dr. Nitin K. Tripathi4, Dr.Turral Hugh51,2,3,4School of Advanced Technologies, Asian Institute of Technology, P.O. Box 4, Klongluang, Pathumthani 12120, ThailandEmail: 1st019869@ait.ac.th, 2honda@ait.ac.th, 3vw@cs.ait.ac.th, 4nitinkt@ait.ac.th 5 International Water Management Institute (IWMI), Columbo, Sri Lanka. Email: H.TURRAL@CGIAR.ORG 1. Introduction The main objective of this study is to use multi-temporal Normalized Difference Vegetation Index (NDVI) and rainfall data for improving the estimation of actual irrigated area in global scale. Firstly, this study started to focus on multi-temporal NDVI of irrigated and non-irrigated crops at local scale. Rice, the most important cereal crop, has been focused and analyzed as a pilot crop. Suphanburi province in Thailand is suitable to be the pilot area because the dominant of agriculture activities in this area is rice cultivation with and without irrigation system. 4.2 Irrigated Rice In irrigated area, farmers can start planting anytime because of water fertility. It is very difficult to define exactly crop calendar in this area. The observed sites of irrigated rice in this study have different planting patterns including with number of crops planting per year (two/three crops a year) and cultivation pattern (homogeneous/heterogeneous). The maximum cultivation in the areas shown in Figure 7-9 is 2 times a year, the second half-year crop always has lower density comparing to the planting in the first half of year. 2. StudyArea Suphanburi is located 169 kilometers from Bangkok, occupying an area of 5,358 square kilometers (Figure 1). Suphanburi has low and flat terrain, 3-10 meters above mean sea level, except in the west where it approaches the mountains of Kanchanaburi and Uthai Thani. Figure 9 Irrigated rice, large continuous field (20 th June 2003) Figure 8 Irrigated rice, large continuous field (26 th April 2003) Figure 7 Irrigated rice, large continuous field. (Map: 621930E, 1578132N) Figure 1 Suphanburi province: Boundary and Irrigation Zone PR PR PR 3. Analysis Steps NDVI Range: -0.69 to 0.82 Number of peak per year: 2 1999 2000 2001 Figure 10 NDVI fluctuation over 3 years of irrigated rice, cultivated 2 times/year (Large continuous field) Figure 11 shown irrigated rice cultivation 3 times per year in northern Suphanburi where most of agriculture area is under irrigated. With a good irrigation system in this area, farmers can continue planting 3 times per year. However the planting unit is smaller than a pixel (around 1 square kilometer) of SPOT VI, one pixel contains many agriculture activities. Therefore the shape of the curve in Figure 14 is not a big wave like Figure 10 because cropping patterns is heterogeneous. 4. Analysis Results NDVI time series over 3 years (1999-2001) were analyzed at various type of rice fields continuously. The fluctuation of NDVI value in time series of irrigated and non-irrigated rice cultivation that was defined based on field survey were discussed together with rainfall which has its peak at the beginning of September. Figure 13 Irrigate rice 3 crops per year, heading stage (20 th June 2003) Figure 12 Irrigate rice 3 crops per year, ripening stages (26th April 2003) 4.1 Rainfed Rice Figure 11 Irrigate rice 3 crops per year, discontinuous/small patchy fields (Map: 611549E, 1620653N). The non-irrigated area observed here is located in Don Chedi district middle Suphanburi. The LANDSAT image (08 Jan 2002: False Color Composite) shown very large and dry area out of planting season (light brown color in the image, Figure 3). PR PR PR NDVI Range: -0.26 to 0.57 Number of peak per year: 3 1999 2000 2001 Figure 14 NDVI fluctuation over 3 years of irrigated rice, cultivated 3 times/year Figure 5Non-irrigated/Rainfed rice field (20 th June 2003) Figure 4 Non-irrigated/Rainfed rice field, dry season (26 th April 2003) Figure 3 Non-irrigated area (Map: 604632E, 1624227N) 5. Summary • Irrigated rice is cultivated 2-3 crops per years with certain periods of sowing but difficult to indicate the exact date. Farmers can start planting anytime because of water fertility in this area. • The first crop of irrigated rice 2 crops per year is always higher peak of NDVI than the latter crops while the NDVI peak of 2 crops per year is higher as twice as 3 crops per year. • NDVI fluctuation of irrigated rice shown low correlation with peak of rainfall while non-irrigated shown much higher correlation. PR PR PR NDVI Range: -0.55 to 0.45 Number of peak per year: 2 Note: PR = Peak of Rainfall. 1999 2000 2001 Figure 6 NDVI fluctuation over 3 years of non-irrigated rice (cultivated 1 times/year) Non-irrigated rice is planted only one time a year, starting around the middle to the end of August till the end of December to the middle of January. After harvested in January, farmers always leave their field blank or change to pasture and will cultivate rice again in the next August. Figure 4 and Figure 5 shown some changes in the same non-irrigated rice field; small grass appeared in the field after rainy season started at the end of May. The pattern of NDVI fluctuation in time series at various type of rice cultivation and its relationship of rainfall will be summarized as a set of criteria. This developed criteria will be used for mapping actual irrigated area in the study area