Download
1 / 1
10 likes | 113 Views
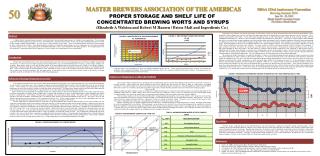
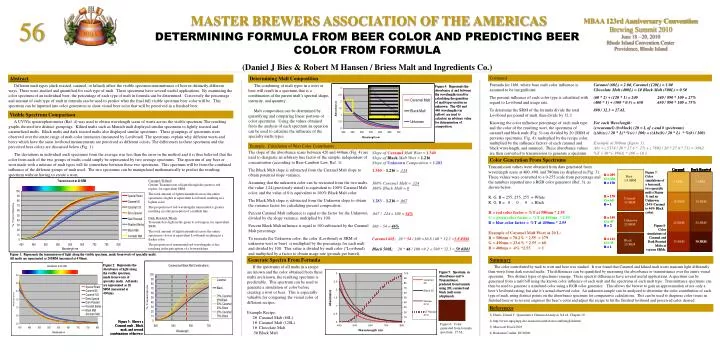
Abstract. Determining Malt Composition. Continued. Formula for 1bbl, where base malt color influence is assumed to be insignificant. The percent influence of each color type is calculated with regard to Lovibond and usage rate.

E N D
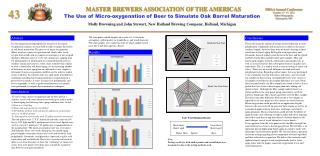
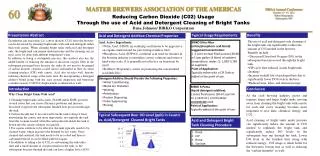
Abstract Determining Malt Composition Continued Formula for 1bbl, where base malt color influence is assumed to be insignificant. The percent influence of each color type is calculated with regard to Lovibond and usage rate. To determine the SRM of the formula divide the total Lovibond per pound of malt, then divide by 32.3. Knowing the color influence percentage of each malt type and the color of the resulting wort, the spectrums of caramel and black malt (Fig. 5) can divided by 20 (SRM of pervious spectrums, Fig. 4), multiplied by the recipe color, multiplied by the influence factors of each caramel and black wavelength, and summed. These absorbance values are then converted to transmission to generate a spectrum. Caramel (60L) = 2.0#, Caramel (120L) = 1.0# Chocolate Malt (400L) = 1# Black Malt (500L) = 0.5# (60 * 2) + (120 * 1) = 240 240 / 890 * 100 = 27% (400 * 1) + (500 * 0.5) = 650 650 / 890 * 100 = 73% 890 / 32.3 = 27.6L For each Wavelength: (c=caramel) (b=black) (20 = L of c and b spectrums) ((Abs(c) / 20 * L)* %(c) / 100) + ((Abs(b) / 20 * L) * %(b) / 100) Example at 500nm (figure 5): Abs = (.5374 / 20 * 27.6 * .27) + (.7802 / 20 * 27.6 *.73) = .9862 %T = 10^(-.9862) * 100 = 10.3 Different malt types (dark roasted, caramel, or kilned) affect the visible spectrum transmittance of beer in distinctly different ways. These were studied and quantified for each type of malt. These spectrums have several useful applications. By examining the color spectrum of an individual beer, the percentage of each type of malt in formula can be determined. Conversely the percentage and amount of each type of malt in formula can be used to predict what the final full visible spectrum beer color will be. This spectrum can be inputted into color generators to show visual beer color that will be perceived in a finished beer. The combining of malt types in a wort or beer will result in a spectrum that is a combination of the parent malt’s spectral shape, intensity, and quantity. Malt composition can be determined by quantifying and comparing linear portions of color spectrums. Using the values obtained from the analysis of each spectrum an equation can be used to calculate the influence of the specialty malts types. Visible Spectrum Comparison A UV/Vis spectrophotometer (Ref. 4) was used to obtain wavelength scans of worts across the visible spectrum. The resulting graphs showed two distinct groupings. Kilned malts such as Munich malt displayed similar spectrums to lightly roasted and caramelized malts. Black malts and dark roasted malts also displayed similar spectrums. These groupings of spectrums were observed over the entire range of malt color intensities (measured by Lovibond). The spectrums explain why different worts and beers which have the same lovibond measurements are perceived as different colors. The differences in these spectrums and the perceived beer colors are discussed below (Fig. 1). The deviations in individual malt spectrums from the average was less than the error in the method and it is thus believed that the color from each of the two groups of malts could simply be represented by two average spectrums. The spectrum of any beer or wort made with a mixture of malt types will lie somewhere between these two spectrums. This spectrum will be from the combined influence of the different groups of malt used. The two spectrums can be manipulated mathematically to predict the resulting spectrum without having to create a wort. Color Generation From Spectrums Transmission values were obtained from data generated from wavelength scans at 400, 490, and 580nm (as displayed in Fig. 3). These values were converted to a 0-255 scale from percentage and the numbers inputted into a RGB color generator (Ref. 3), as shown below. R, G, B = 255, 255, 255 = White R, G, B = 0 , 0 , 0 = Black R = red color factor = %T at 580nm * 2.55 G = green color factor = %T at 490nm * 2.55 B = blue color factor = %T at 400nm * 2.55 Example of Caramel Malt Wort at 20 L: R = 580nm = 70.2% * 2.55 = 179 G = 490nm = 23.6% * 2.55 = 60 B = 400nm = .4% *2.55 = 1 Summary Generate Spectra From Formula The color contributed by malt to wort and beer was studied. It was found that Caramel and kilned malt worts transmit light differently than worts from dark roasted malts. The differences can be quantified by measuring the absorbance or transmittance over the entire visual spectrum. Two distinct types of spectrums emerge. These spectral differences have several useful applications. A spectrum can be generated from a malt bill using the known color influence of each malt and the spectrums of each malt type. Transmittance spectrums can then be used to generate a simulated color using a RGB color generator. This allows the brewer to gain an approximation of not only a beer’s lovibond rating, but also it’s actual observed color. An unknown sample can be analyzed to determine the color contribution of each type of malt, using distinct points on the absorbance spectrum for comparative calculations. This can be used to diagnose color issues in finished beer or to reverse engineer the beer’s color and adjust the recipe to hit the finished lovibond and perceived color desired. If the spectrums of all malts in a recipe are known and the color obtained from these malts are known, the resulting spectrum is predictable. This spectrum can be used to generate a simulation of color before creating a wort or beer. This is especially valuable for comparing the visual color of different recipes. Example Recipe: 2# Caramel Malt (60L) 1# Caramel Malt (120L) 1# Chocolate Malt .5# Black Malt References 1) Harris, Daniel C. Quantitative Chemical Analysis 3rd ed. Chapter 19 2) http://www.mpq.mpg.de/~haensch/comb/Astrocomb/english.html 3) Microsoft Excel 2003 4) Beckman Coulter, DU®800 Figure 6: Color generated from formula spectrum. 27.6L. MASTER BREWERS ASSOCIATION OF THE AMERICAS 56 MBAA 123rd Anniversary Convention Brewing Summit 2010June 18 – 20, 2010Rhode Island Convention CenterProvidence, Rhode Island DETERMINING FORMULA FROM BEER COLOR AND PREDICTING BEER COLOR FROM FORMULA (Daniel J Bies & Robert M Hansen / Briess Malt and Ingredients Co.) Example: Calculation of Wort Color Contributors The slope of the absorbance scans between 420 and 440nm (Fig. 4) are used to designate an arbitrary hue factor of the sample, independent of concentration (according to Beer-Lambert Law, Ref. 1). The Black Malt slope is subtracted from the Caramel Malt slope to obtain potential slope variance. Assuming that the unknown color can be recreated from the two malts, the value .124 (previously stated) is equivalent to 100% Caramel Malt color, and the value of 0 is equivalent to 100% Black Malt color. The Black Malt slope is subtracted from the Unknown slope to obtain the variance factor for calculating percent composition. Percent Caramel Malt influence is equal to the factor for the Unknown divided by the slope variance, multiplied by 100. Percent Black Malt influence is equal to 100 subtracted by the Caramel Malt percentage. To recreate the Unknown color, the color (Lovibond) or SRM of unknown wort or beer) is multiplied by the percentage for each malt and divided by 100. This value is divided by malt color (°Lovibond) and multiplied by a factor to obtain usage rate (pounds per barrel). Slope of Caramel Malt Wort = 1.340 Slope of Black Malt Wort = 1.216 Slope of Unknown Composition = 1.283 1.340 – 1.216 = .124 100% Caramel Malt = .124 100% Black Malt = 0 1.283 – 1.216 = .067 .067 / .124 x 100 = 54% 100 – 54 = 46% Caramel 60L: 20 * 54 / 100 =10.8 / 60 * 32.3 =5.8 #/bbl Black 500L: 20 * 46 / 100 =9.2 ÷ 500 * 32.3 =.59 #/bbl Caramel / Kilned Greater Transmission of light through the green to red region, for equivalent SRM. The total amount of light transmitted across the entire spectrum is higher at equivalent Lovibonds resulting in a lighter color. The proportion of red-wavelengths transmitted is greater resulting in a the perception of a reddish hue. Dark Roasted / Black Transmits less light in the green to red region, for equivalent SRM. The total amount of light transmitted across the entire spectrum is lower at equivalent Lovibonds resulting in a darker color. The proportion of transmitted red-wavelengths is less resulting in the perception of a brownish hue.